Silicon Valley Bank Results Presentation Deck
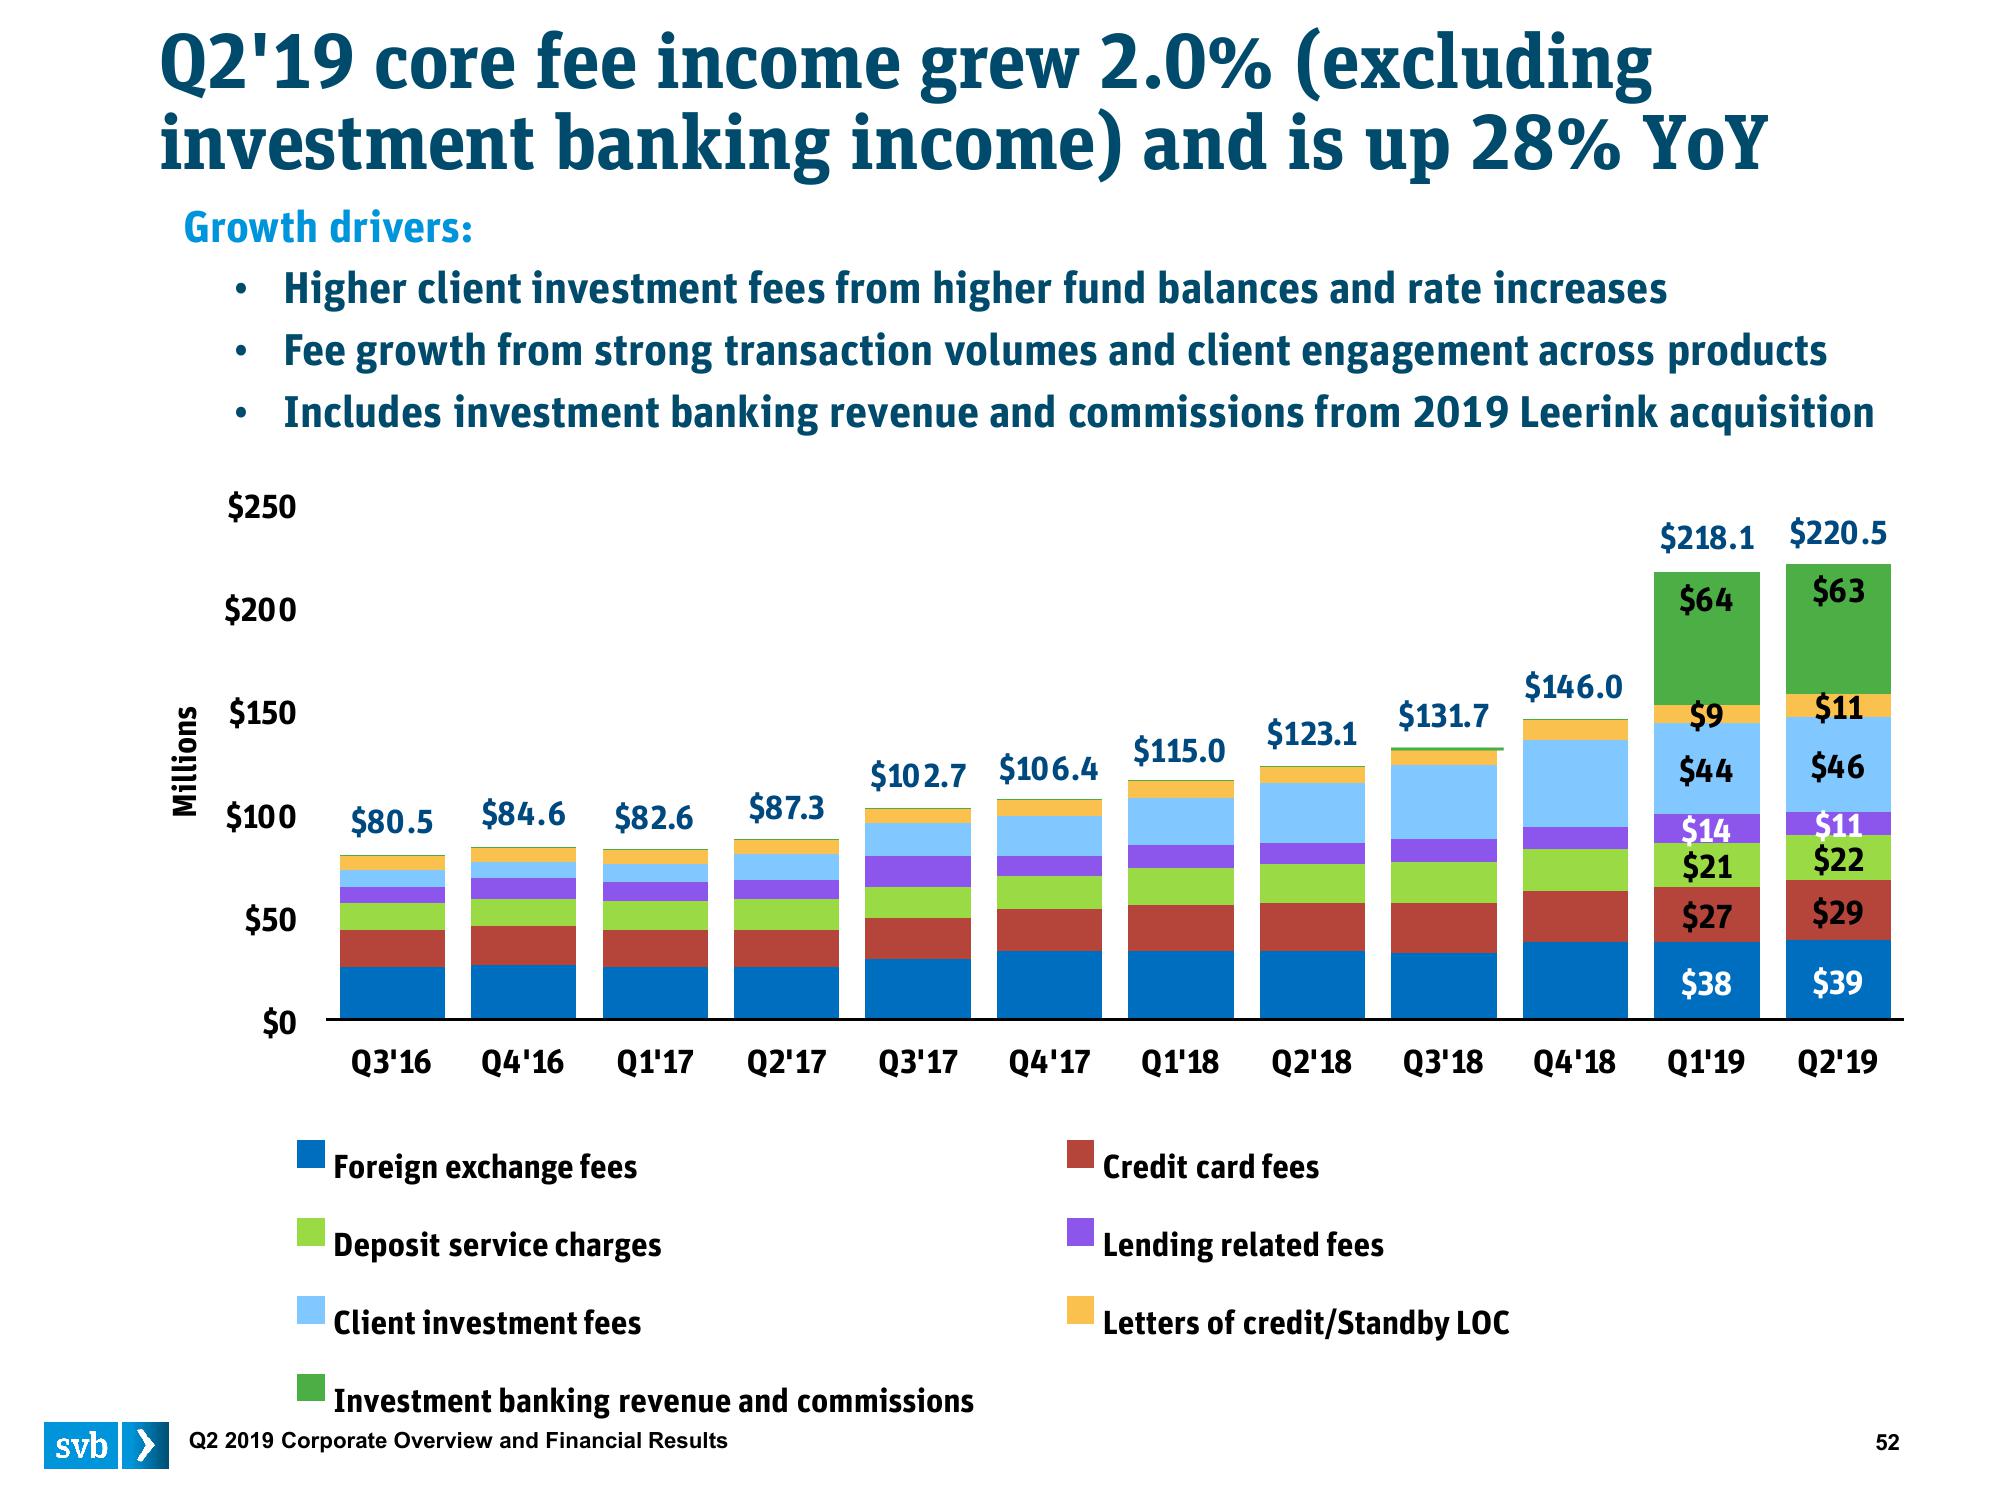
Q2'19 core fee income grew 2.0% (excluding
investment banking income) and is up 28% YoY
Growth drivers:
Millions
●
●
●
Higher client investment fees from higher fund balances and rate increases
Fee growth from strong transaction volumes and client engagement across products
Includes investment banking revenue and commissions from 2019 Leerink acquisition
$250
$200
$150
$100 $80.5 $84.6 $82.6 $87.3
$50
$0
$102.7 $106.4
Q3'16 Q4'16 Q1'17 Q2'17 Q3'17 Q4'17
Foreign exchange fees
Deposit service charges
Client investment fees
Investment banking revenue and commissions
svb> Q2 2019 Corporate Overview and Financial Results
$115.0
$123.1
Q1'18 Q2'18
Credit card fees
$131.7
$146.0
$9
$11
$44
$46
$14
$11
$21
$22
$27
$29
$38
$39
Q3'18 Q4'18 Q1'19 Q2'19
Lending related fees
Letters of credit/Standby LOC
$218.1 $220.5
$64
$63
52View entire presentation