Kinnevik Results Presentation Deck
Intro
SEK m
GROUP FINANCIAL STATEMENTS
Change in fair value of financial assets
Dividends received
Consolidated Income Statement and report concerning Total Comprehensive Income
Administration costs
Other operating income
Other operating expenses
Operating profit/loss
Net Asset Value
Interest income and other financial income
Interest expenses and other financial expenses
Profit/loss after financial net
Tax
Net profit/loss for the period
Total comprehensive income for the period
Net profit/loss per share before dilution, SEK
Net profit/loss per share after dilution, SEK
Outstanding shares at the end of the period
Average number of shares before dilution
Average number of shares after dilution
KINNEVIK
Interim Report Q3 2022
Note
Portfolio Overview
4
5
Q3 2022
-3 129
0
-81
3
0
-3 207
70
-27
-3 164
0
-3 164
-3 164
-11.30
-11.30
280 042 974
280 042 974
280 042 974
Q3 2021
-255
-53
2
0
-306
0
-11
-317
0
-317
-317
-1.14
-1.14
277 843 665
Sustainability
277 871 501
277 871 501
Jan-Sep 2022
-17 419
3 077
-223
8
-1
-14 558
317
-193
-14 434
0
-14 434
-14 434
-51.67
-51.67
280 042 974
279 360 120
279 360 120
Jan-Sep 2021
17 331
1 126
-198
6
-3
18 262
18
-36
18 244
0
18 244
18 244
65.66
65.66
277 843 665
277 839 346
277 839 346
FY 2021
13 269
1 689
-319
10
-3
14 646
210
-74
14 782
-5
14 777
14 777
53.12
53.12
278 677 265
278 177 851
278 177 851
Financial Statements
Other
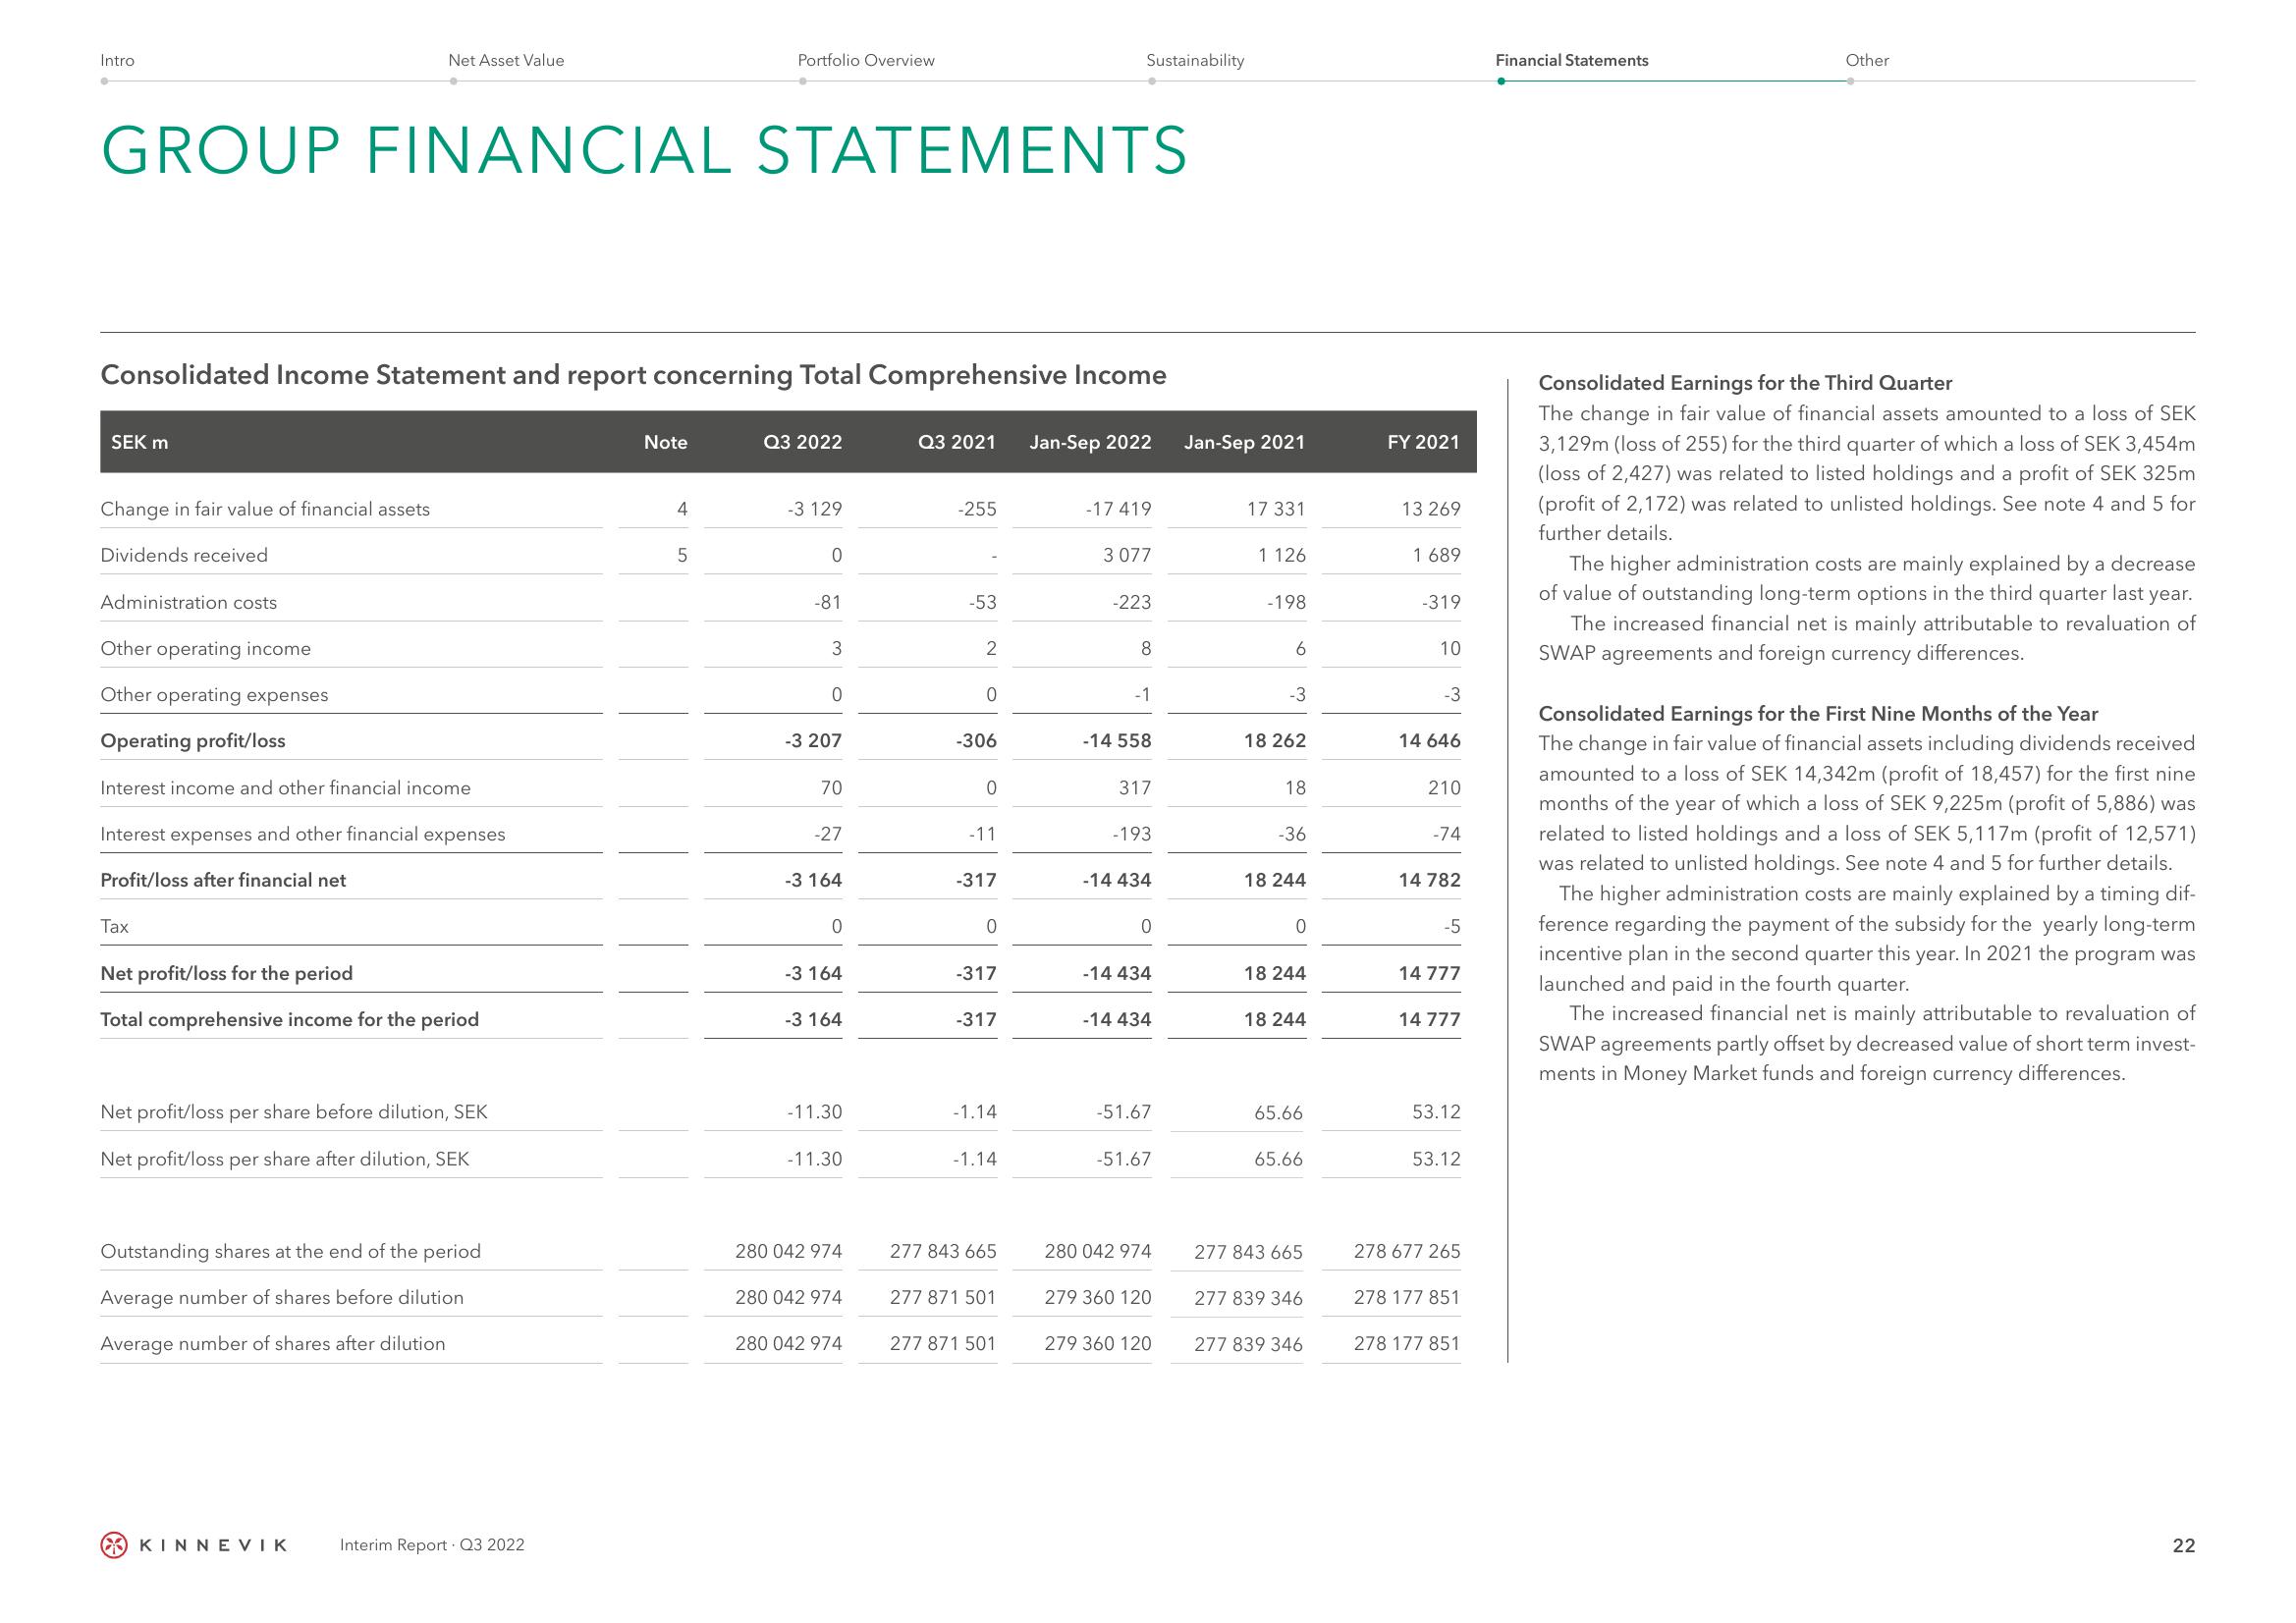
Consolidated Earnings for the Third Quarter
The change in fair value of financial assets amounted to a loss of SEK
3,129m (loss of 255) for the third quarter of which a loss of SEK 3,454m
(loss of 2,427) was related to listed holdings and a profit of SEK 325m
(profit of 2,172) was related to unlisted holdings. See note 4 and 5 for
further details.
The higher administration costs are mainly explained by a decrease
of value of outstanding long-term options in the third quarter last year.
The increased financial net is mainly attributable to revaluation of
SWAP agreements and foreign currency differences.
Consolidated Earnings for the First Nine Months of the Year
The change in fair value of financial assets including dividends received
amounted to a loss of SEK 14,342m (profit of 18,457) for the first nine
months of the year of which a loss of SEK 9,225m (profit of 5,886) was
related to listed holdings and a loss of SEK 5,117m (profit of 12,571)
was related to unlisted holdings. See note 4 and 5 for further details.
The higher administration costs are mainly explained by a timing dif-
ference regarding the payment of the subsidy for the yearly long-term
incentive plan in the second quarter this year. In 2021 the program was
launched and paid in the fourth quarter.
The increased financial net is mainly attributable to revaluation of
SWAP agreements partly offset by decreased value of short term invest-
ments in Money Market funds and foreign currency differences.
22View entire presentation