AstraZeneca Results Presentation Deck
Reported profit and loss
Total revenue
- product sales
- collaboration revenue
Gross margin
Operating expenses¹
- R&D² expenses
- SG&A³ expenses
Other operating income
Operating profit
Tax rate
EPS
FY 2020
$m
26,617
25,890
727
79.5%
17,684
5,991
11,294
1,528
5,162
19.7%
$2.44
change
%
10
11
(11)
0.5 pp4
(2)
(1)
(3)
(1)
81
142
% total
revenue
100
97
3
66
23
42
6
19
Q4 2020
$m
7,410
7,011
399
78.2%
5,038
1,719
3,210
640
1,487
13.9%
$0.78
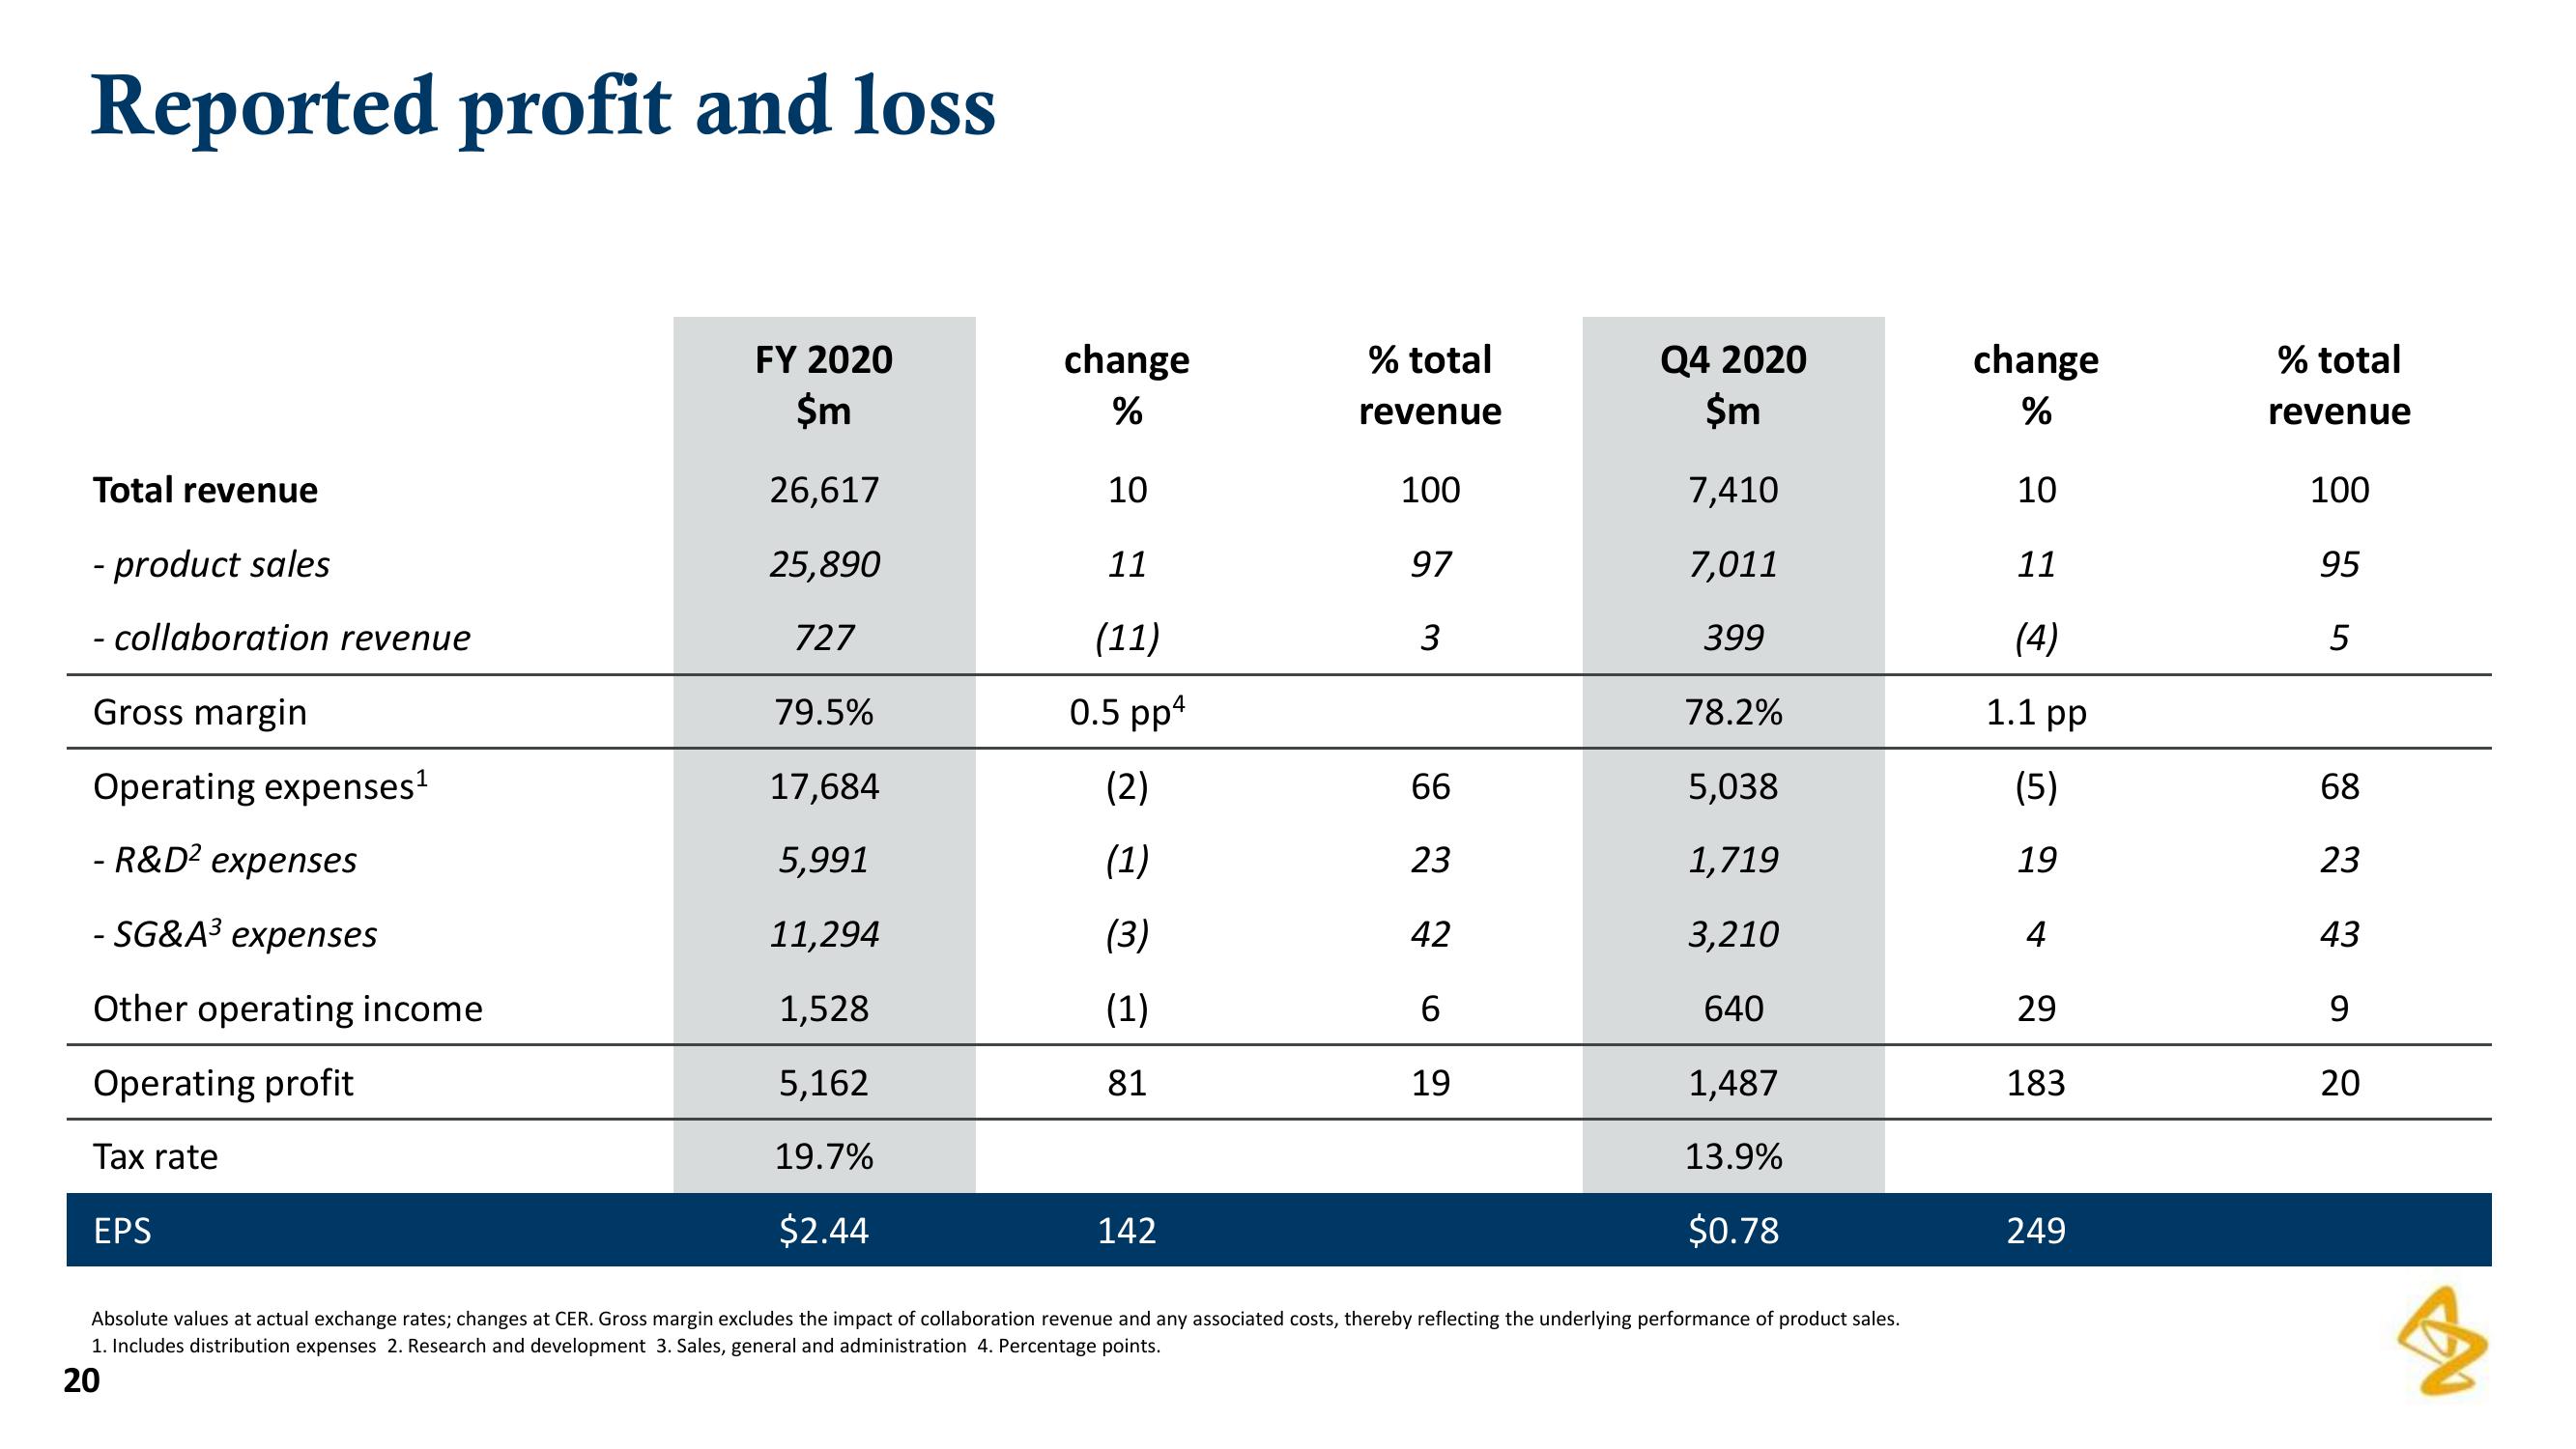
Absolute values at actual exchange rates; changes at CER. Gross margin excludes the impact of collaboration revenue and any associated costs, thereby reflecting the underlying performance of product sales.
1. Includes distribution expenses 2. Research and development 3. Sales, general and administration 4. Percentage points.
20
change
%
10
11
(4)
1.1 pp
(5)
19
4
29
183
249
% total
revenue
100
95
5
68
23
43
9
20
3View entire presentation