Roblox Results Presentation Deck
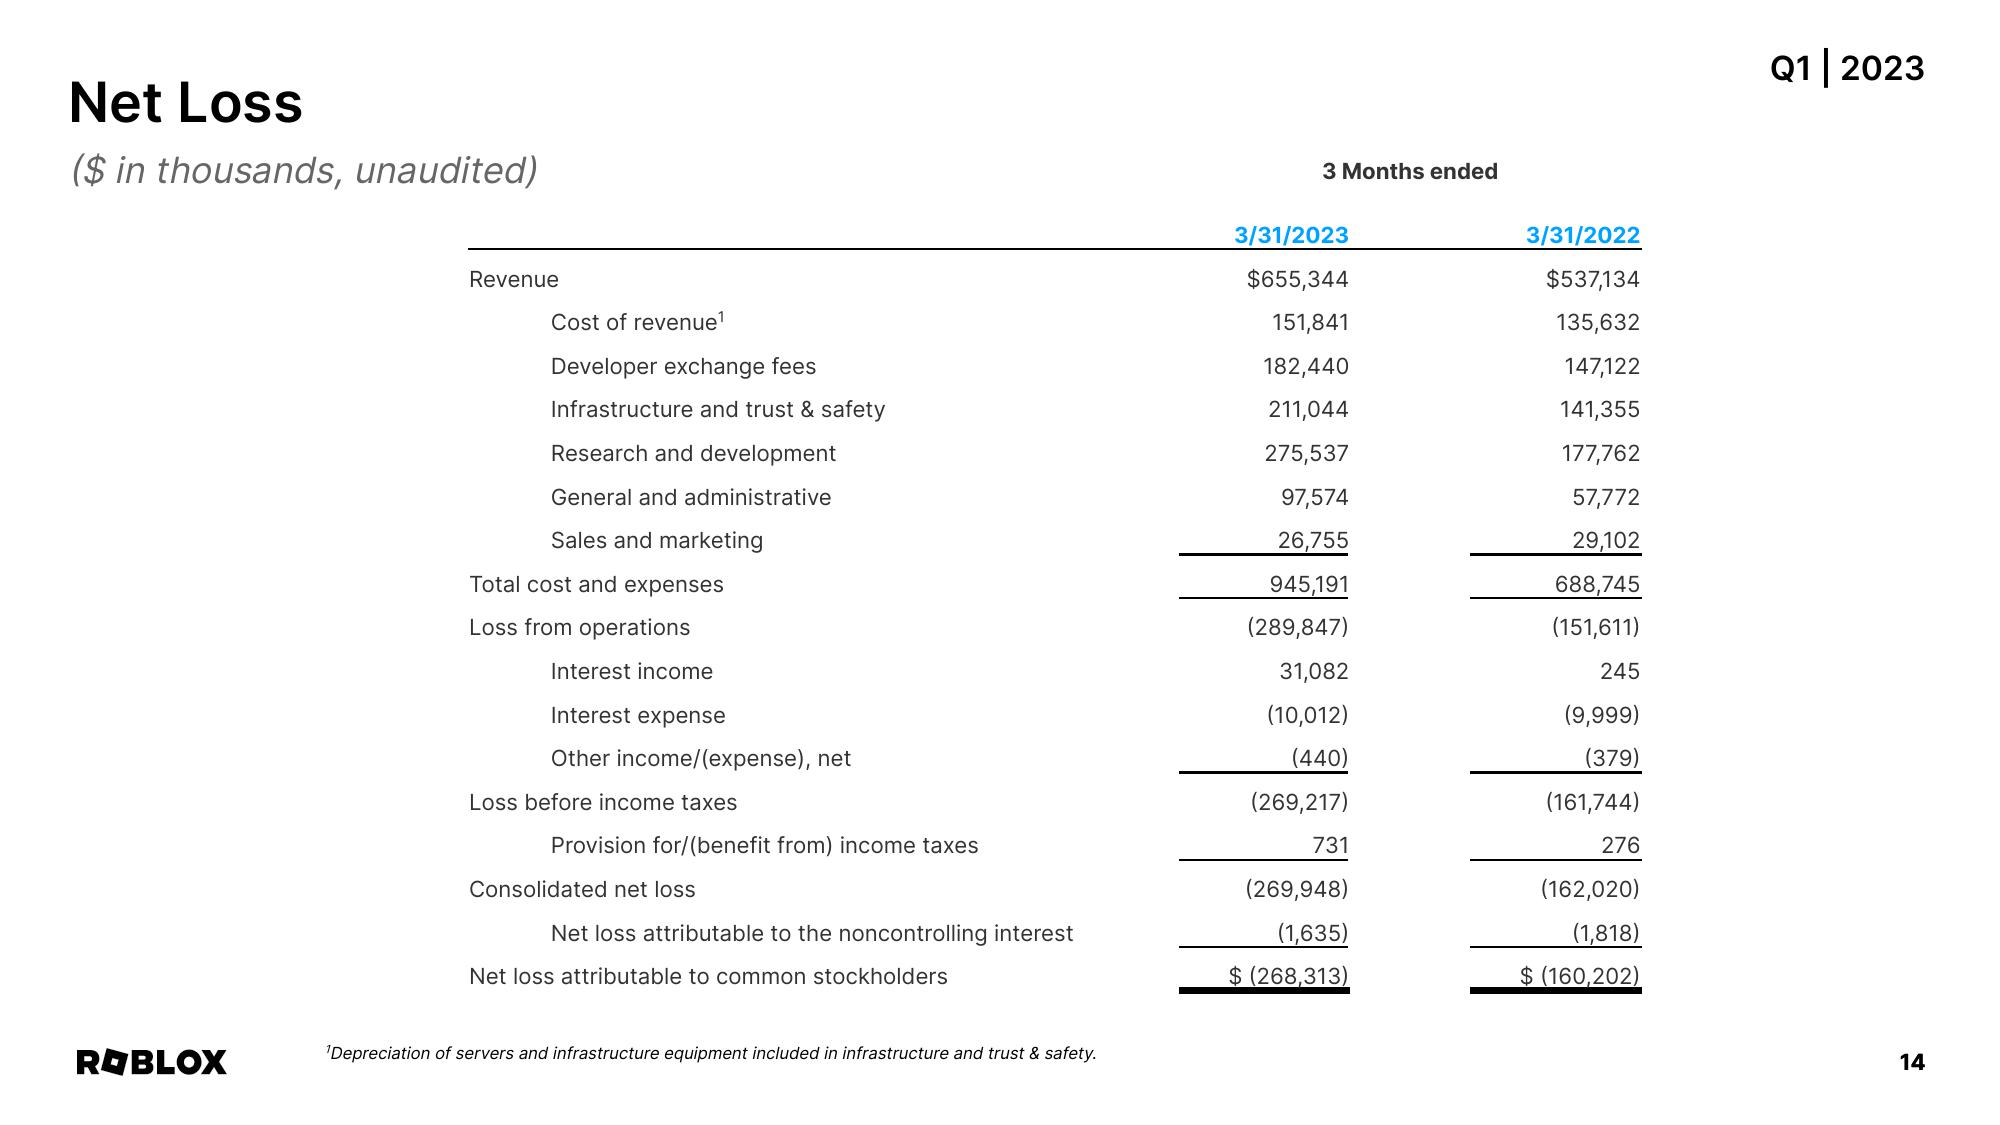
Net Loss
($ in thousands, unaudited)
ROBLOX
Revenue
Cost of revenue¹
Developer exchange fees
Infrastructure and trust & safety
Research and development
General and administrative
Sales and marketing
Total cost and expenses
Loss from operations
Interest income
Interest expense
Other income/(expense), net
Loss before income taxes
Provision for/(benefit from) income taxes
Consolidated net loss
Net loss attributable to the noncontrolling interest
Net loss attributable to common stockholders
¹Depreciation of servers and infrastructure equipment included in infrastructure and trust & safety.
3 Months ended
3/31/2023
$655,344
151,841
182,440
211,044
275,537
97,574
26,755
945,191
(289,847)
31,082
(10,012)
(440)
(269,217)
731
(269,948)
(1,635)
$(268,313)
3/31/2022
$537,134
135,632
147,122
141,355
177,762
57,772
29,102
688,745
(151,611)
245
(9,999)
(379)
(161,744)
276
(162,020)
(1,818)
$ (160,202)
Q1 2023
14View entire presentation