Bigbear AI SPAC Presentation Deck
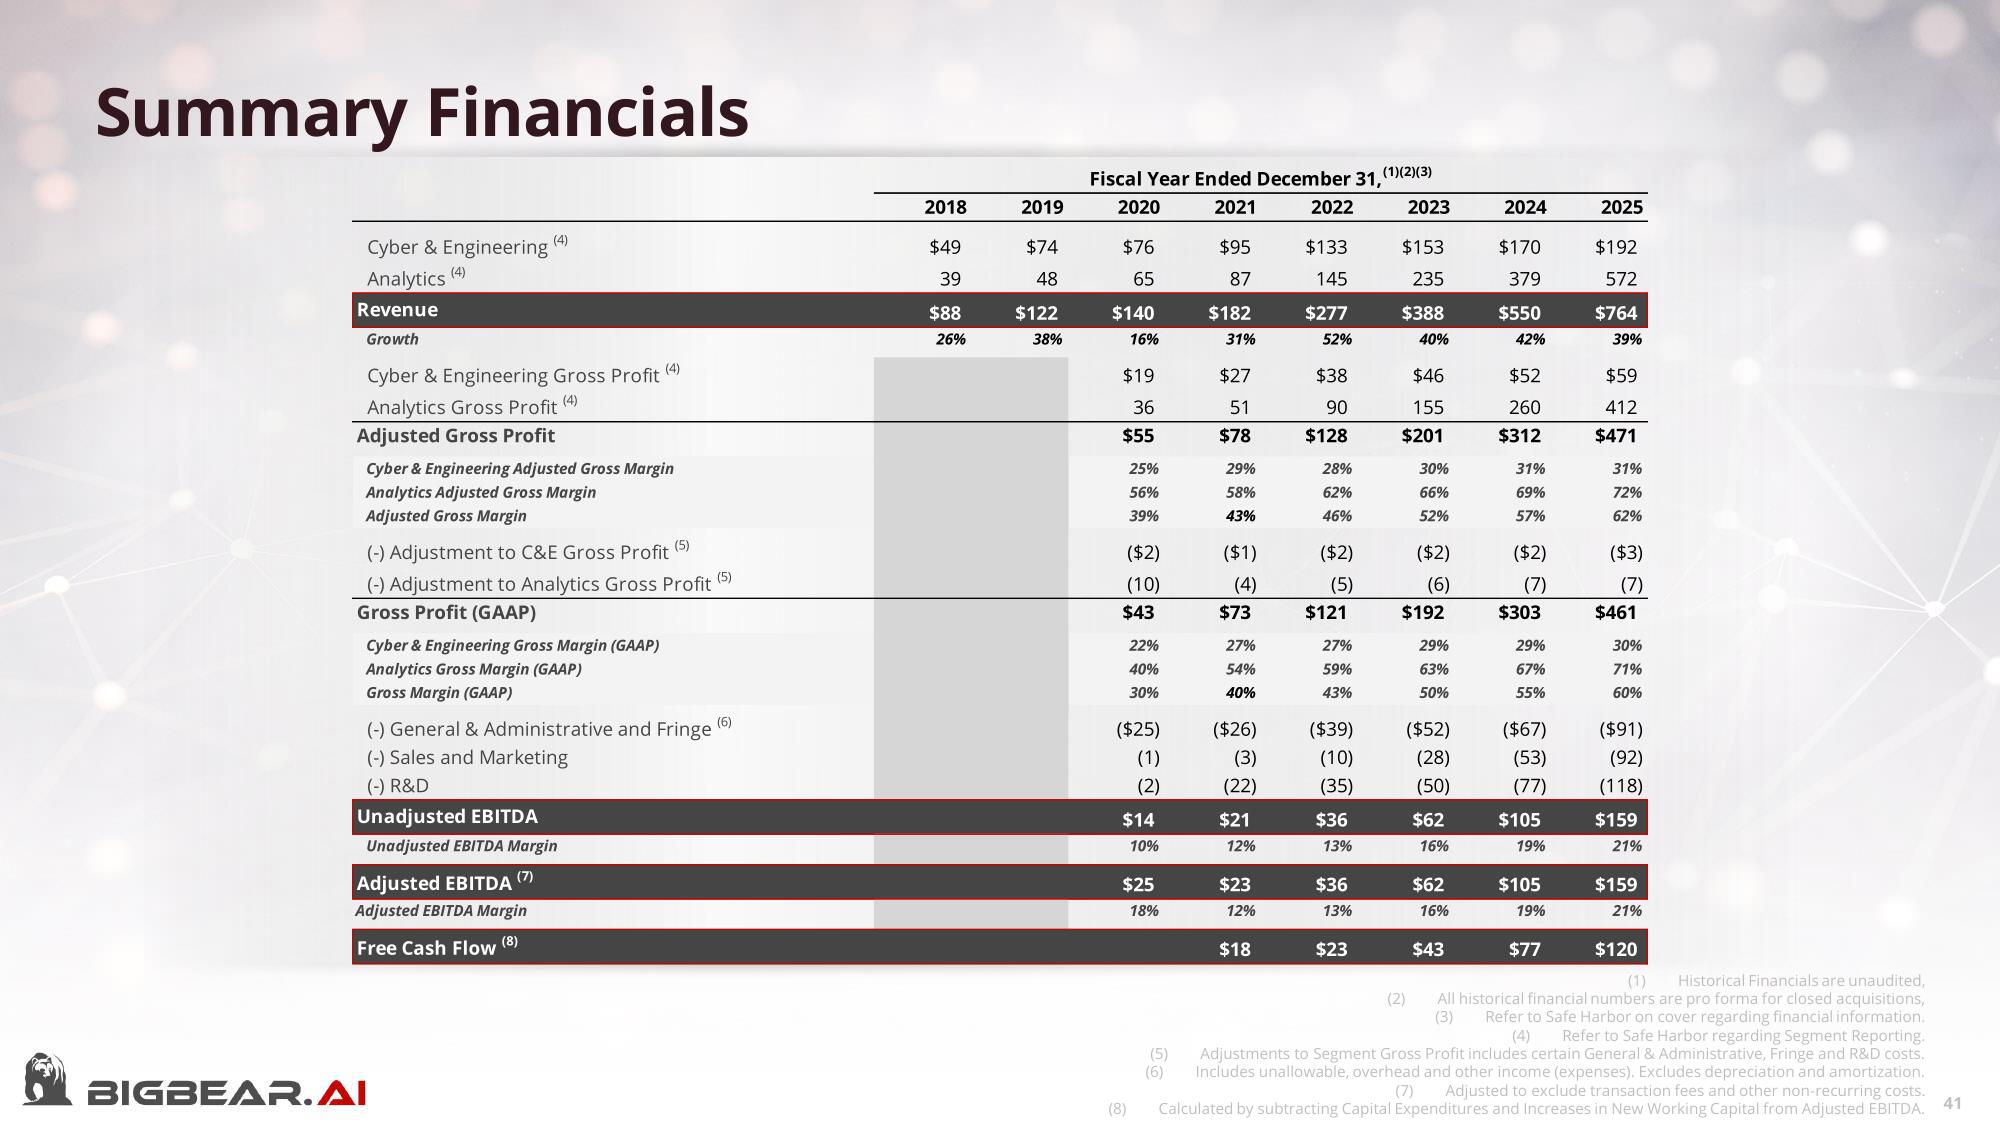
Summary Financials
Cyber & Engineering
Analytics
Revenue
Growth
(4)
(4)
Cyber & Engineering Gross Profit
(4)
(4)
Analytics Gross Profit
Adjusted Gross Profit
Cyber & Engineering Adjusted Gross Margin
Analytics Adjusted Gross Margin
Adjusted Gross Margin
(5)
(-) Adjustment to C&E Gross Profit
(-) Adjustment to Analytics Gross Profit (5)
Gross Profit (GAAP)
Cyber & Engineering Gross Margin (GAAP)
Analytics Gross Margin (GAAP)
Gross Margin (GAAP)
(-) General & Administrative and Fringe
(-) Sales and Marketing
(-) R&D
BIGBEAR. AI
Unadjusted EBITDA
Unadjusted EBITDA Margin
(7)
Adjusted EBITDA
Adjusted EBITDA Margin
Free Cash Flow (8)
(6)
2018
$49
39
$88
26%
2019
$74
48
$122
38%
Fiscal Year Ended December 31,
2020
2022
2021
$95
87
$182
31%
$76
65
$140
16%
$19
36
$55
25%
56%
39%
($2)
(10)
$43
22%
40%
30%
($25)
(1)
(2)
$14
(8)
10%
$25
18%
$27
51
$78
(5)
(6)
29%
58%
43%
($1)
(4)
$73
27%
54%
40%
($26)
(3)
(22)
$21
12%
$23
12%
$18
$133
145
$277
52%
$38
90
$128
28%
62%
46%
($2)
(5)
$121
27%
59%
43%
($39)
(10)
(35)
$36
13%
$36
13%
$23
(1)(2)(3)
2023
$153
235
$388
40%
$46
155
$201
30%
66%
52%
(2)
($2)
(6)
$192
29%
63%
50%
($52)
(28)
(50)
$62
16%
$62
16%
$43
2024
$170
379
$550
42%
$52
260
$312
31%
69%
57%
($2)
(7)
$303
29%
67%
55%
($67)
(53)
(77)
$105
19%
$105
19%
$77
2025
$192
572
$764
39%
$59
412
$471
31%
72%
62%
($3)
(7)
$461
30%
71%
60%
($91)
(92)
(118)
$159
21%
$159
21%
(1) Historical Financials are unaudited,
All historical financial numbers are pro forma for closed acquisitions,
(3) Refer to Safe Harbor on cover regarding financial information.
(4) Refer to Safe Harbor regarding Segment Reporting.
Adjustments to Segment Gross Profit includes certain General & Administrative, Fringe and R&D costs.
Includes unallowable, overhead and other income (expenses). Excludes depreciation and amortization.
Adjusted to exclude transaction fees and other non-recurring costs.
Calculated by subtracting Capital Expenditures and Increases in New Working Capital from Adjusted EBITDA.
$120
41View entire presentation