Credit Suisse Credit Presentation Deck
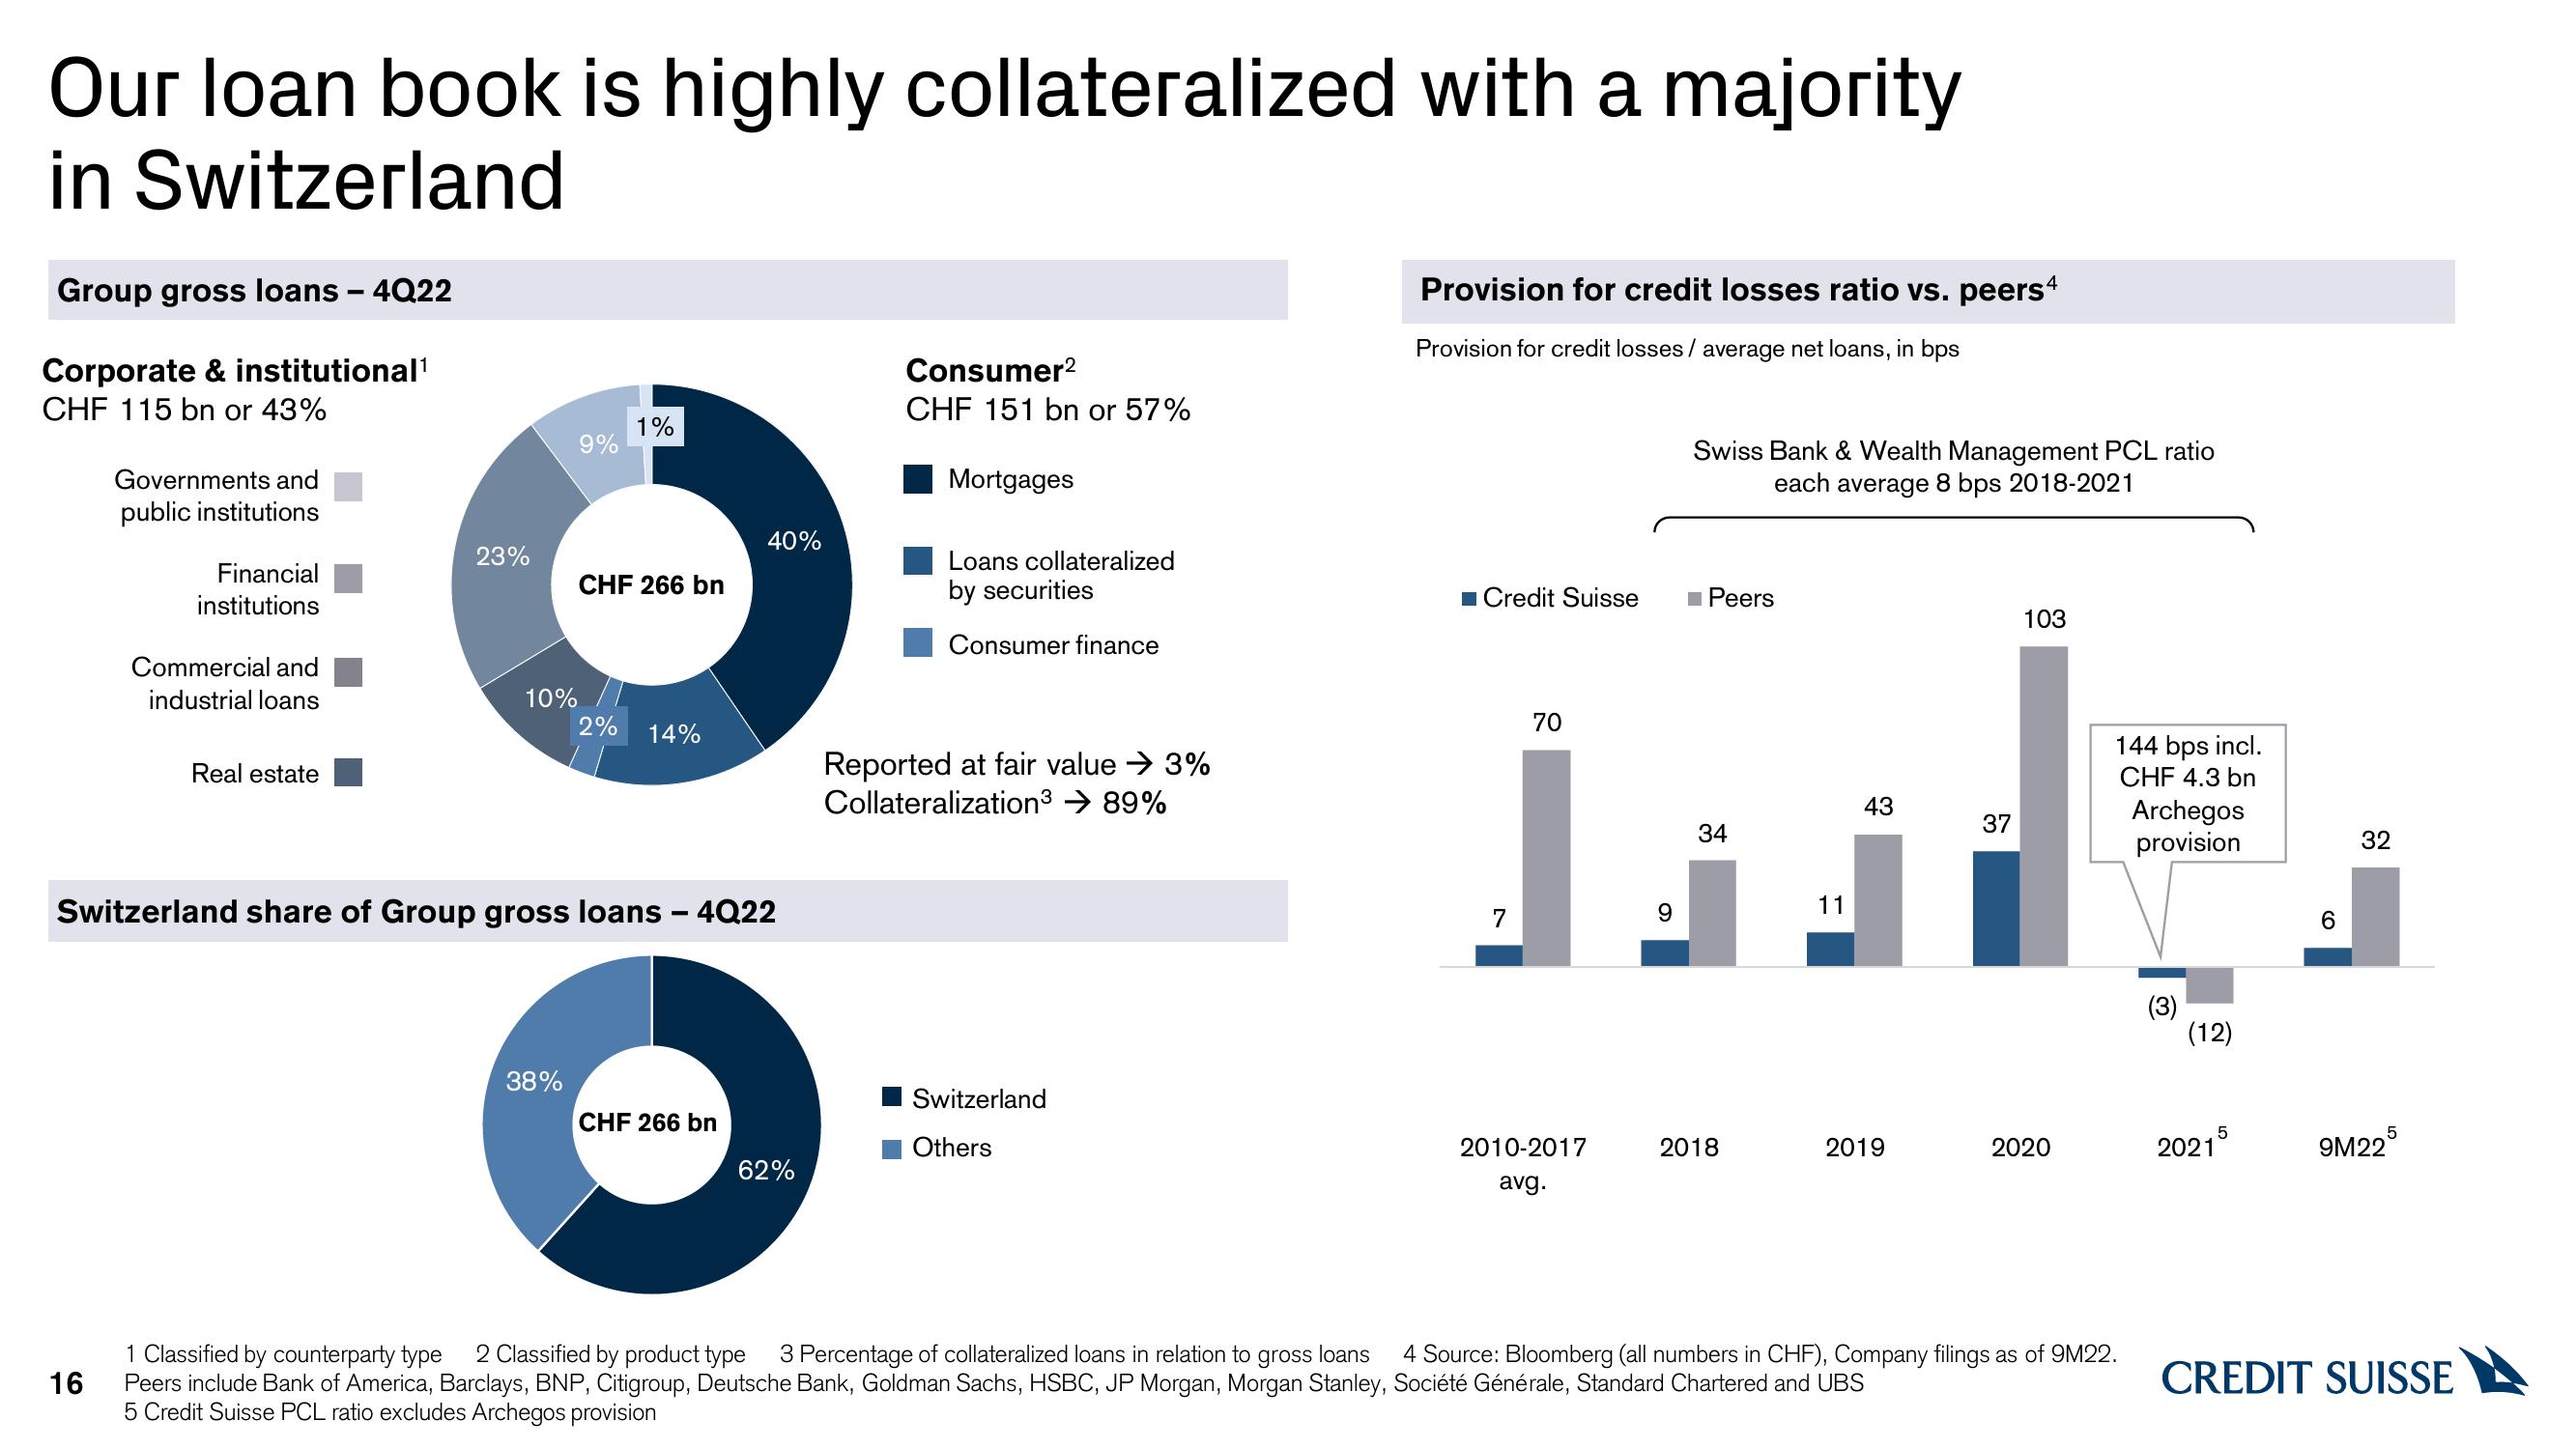
Our loan book is highly collateralized with a majority
in Switzerland
Group gross loans - 4Q22
Corporate & institutional¹
CHF 115 bn or 43%
Governments and
public institutions
16
Financial
institutions
Commercial and
industrial loans
Real estate
23%
10%
9%
38%
1%
CHF 266 bn
2%
14%
Switzerland share of Group gross loans - 4Q22
40%
CHF 266 bn
62%
Consumer²
CHF 151 bn or 57%
Mortgages
Loans collateralized
by securities
Consumer finance
Reported at fair value → 3%
Collateralization³ → 89%
Switzerland
Others
Provision for credit losses ratio vs. peers4
Provision for credit losses / average net loans, in bps
■Credit Suisse
7
70
2010-2017
avg.
9
Swiss Bank & Wealth Management PCL ratio
each average 8 bps 2018-2021
■ Peers
34
2018
11
43
2019
37
103
2020
144 bps incl.
CHF 4.3 bn
1 Classified by counterparty type 2 Classified by product type 3 Percentage of collateralized loans in relation to gross loans 4 Source: Bloomberg (all numbers in CHF), Company filings as of 9M22.
Peers include Bank of America, Barclays, BNP, Citigroup, Deutsche Bank, Goldman Sachs, HSBC, JP Morgan, Morgan Stanley, Société Générale, Standard Chartered and UBS
5 Credit Suisse PCL ratio excludes Archegos provision
Archegos
provision
(3)
(12)
20215
6
32
9M225
CREDIT SUISSEView entire presentation