Ashtead Group Results Presentation Deck
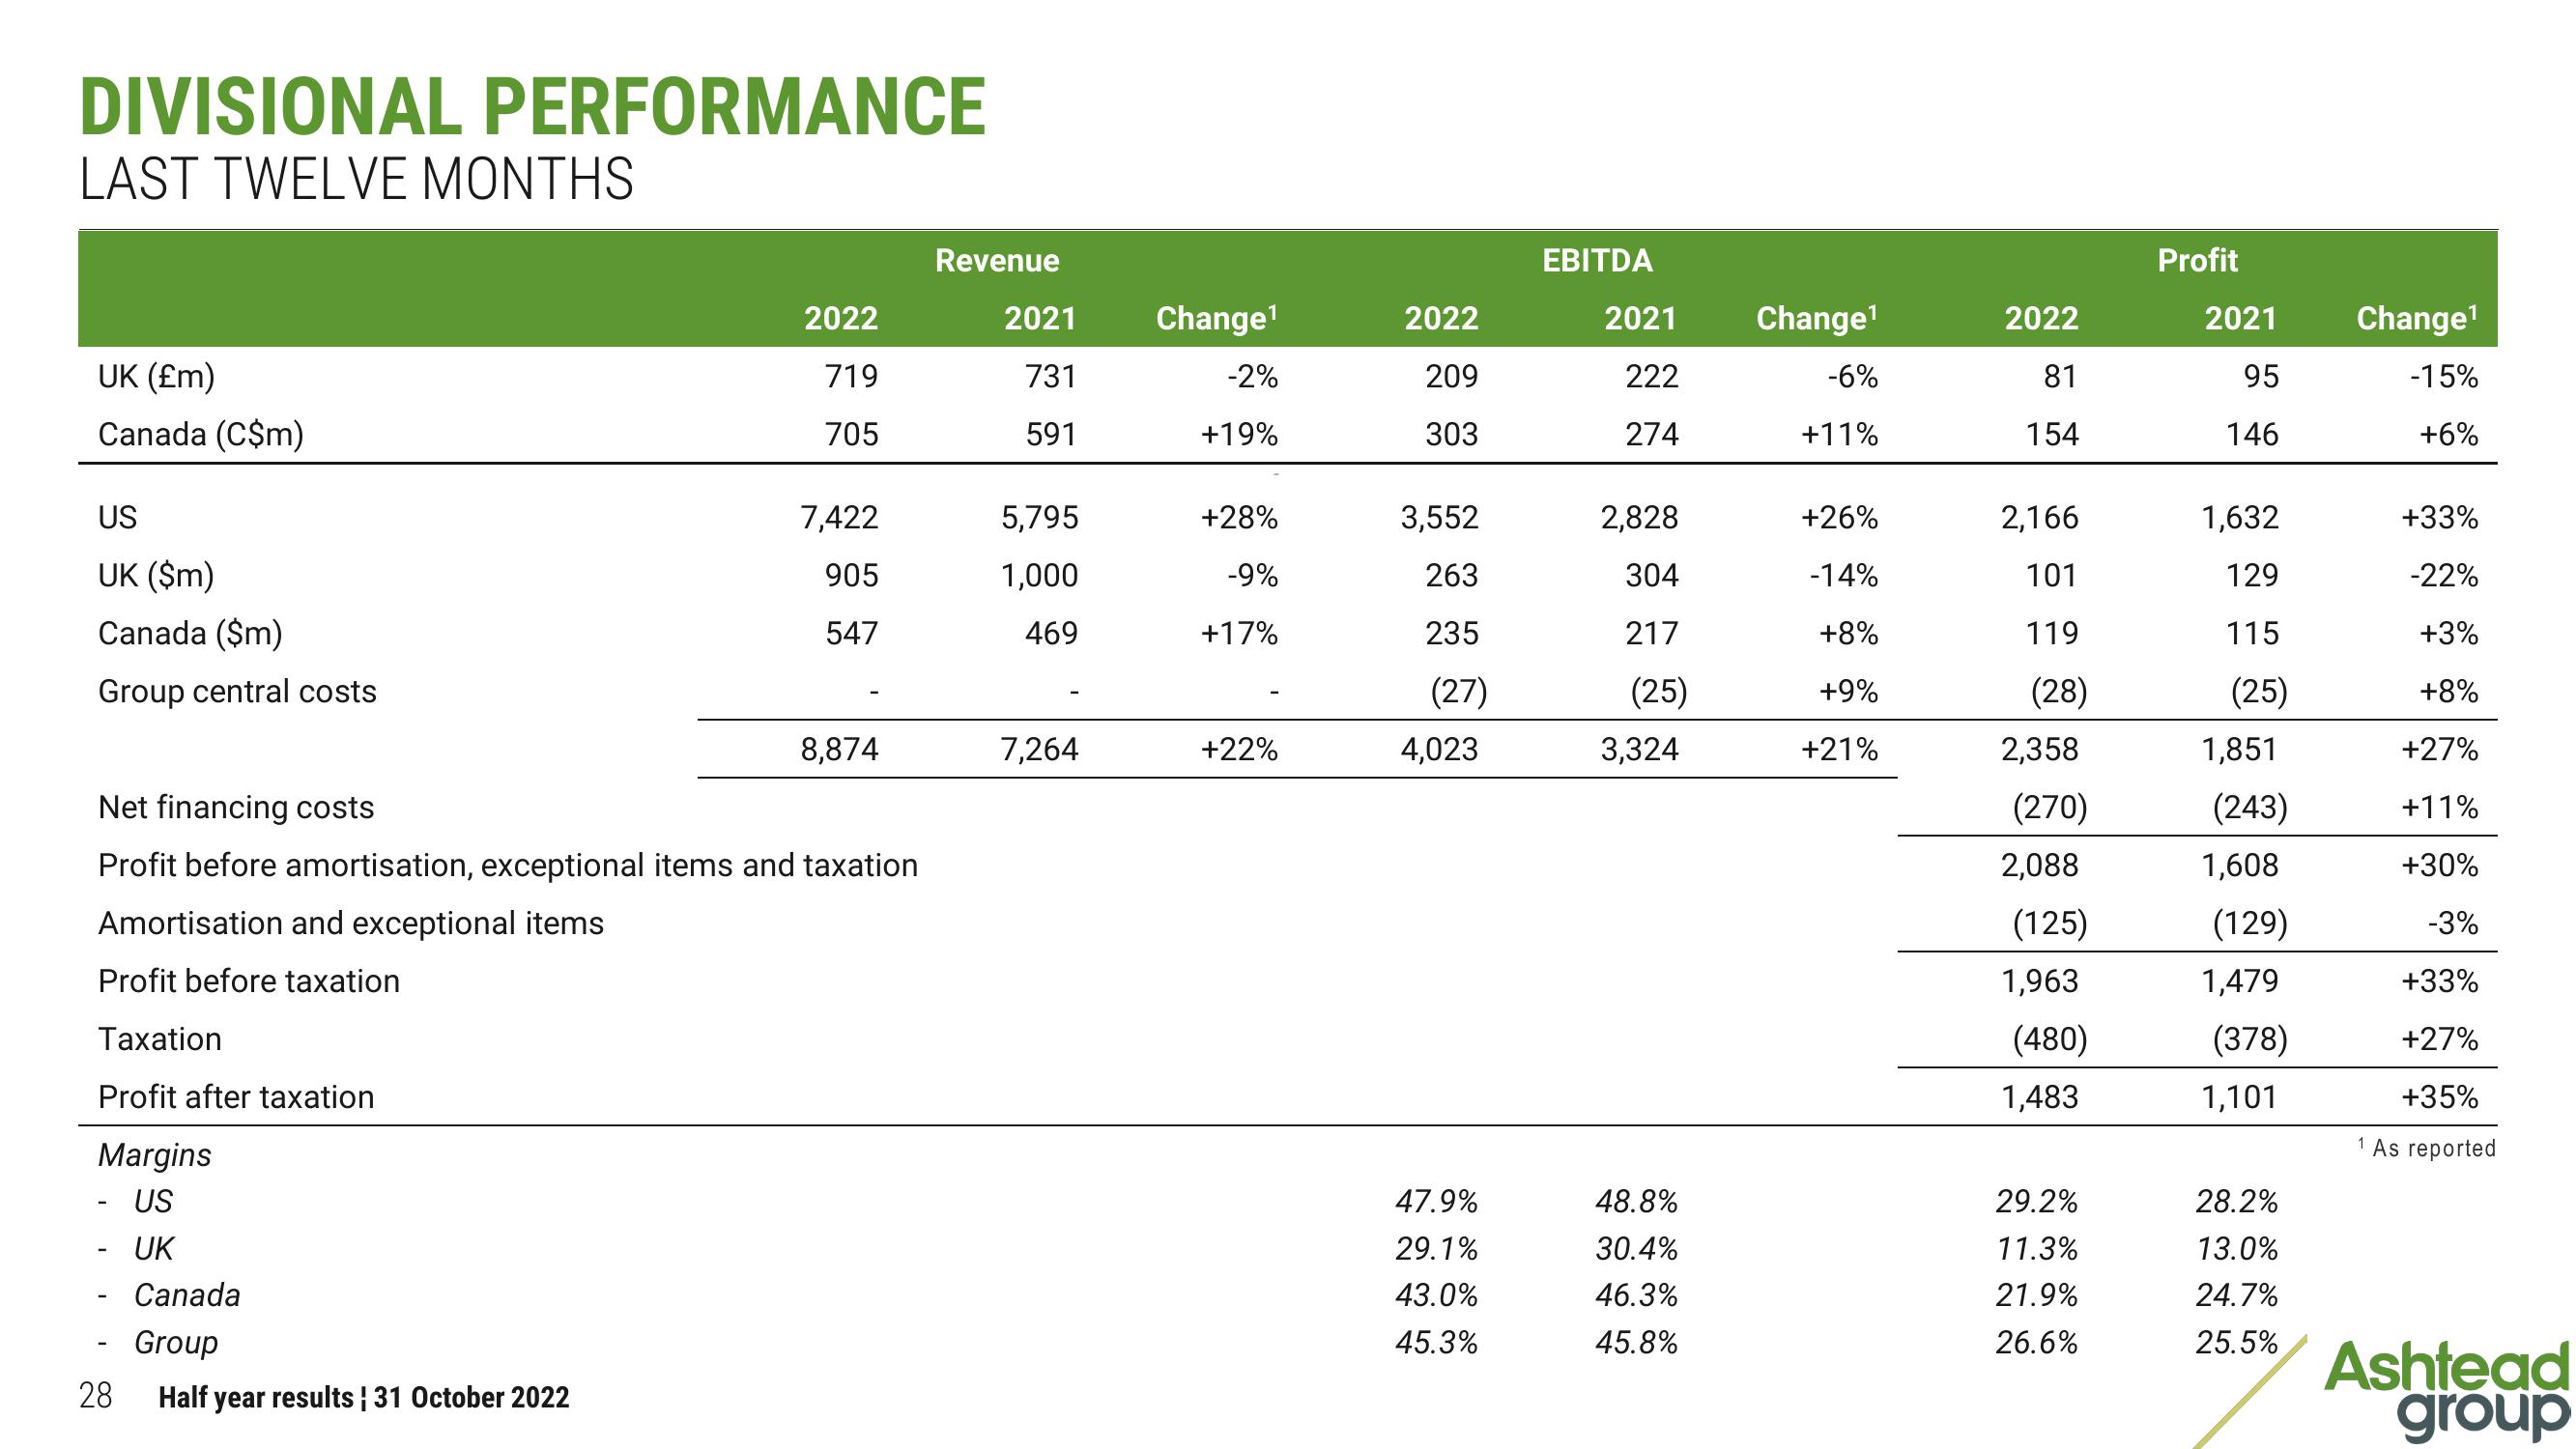
DIVISIONAL PERFORMANCE
LAST TWELVE MONTHS
UK (£m)
Canada (C$m)
US
UK ($m)
Canada ($m)
Group central costs
28
2022
719
705
Canada
Group
Half year results ¦ 31 October 2022
7,422
905
547
Net financing costs
Profit before amortisation, exceptional items and taxation
Amortisation and exceptional items
Profit before taxation
Taxation
Profit after taxation
Margins
- US
UK
8,874
Revenue
2021
731
591
5,795
1,000
469
7,264
Change¹
-2%
+19%
+28%
-9%
+17%
+22%
2022
209
303
3,552
263
235
(27)
4,023
47.9%
29.1%
43.0%
45.3%
EBITDA
2021
222
274
2,828
304
217
(25)
3,324
48.8%
30.4%
46.3%
45.8%
Change¹
-6%
+11%
+26%
-14%
+8%
+9%
+21%
2022
81
154
2,166
101
119
(28)
2,358
(270)
2,088
(125)
1,963
(480)
1,483
29.2%
11.3%
21.9%
26.6%
Profit
2021
95
146
1,632
129
115
(25)
1,851
(243)
1,608
(129)
1,479
(378)
1,101
28.2%
13.0%
24.7%
25.5%
Change¹
-15%
+6%
1
+33%
-22%
+3%
+8%
+27%
+11%
+30%
-3%
+33%
+27%
+35%
As reported
Ashtead
groupView entire presentation