J.P.Morgan Results Presentation Deck
JPMORGAN CHASE & CO.
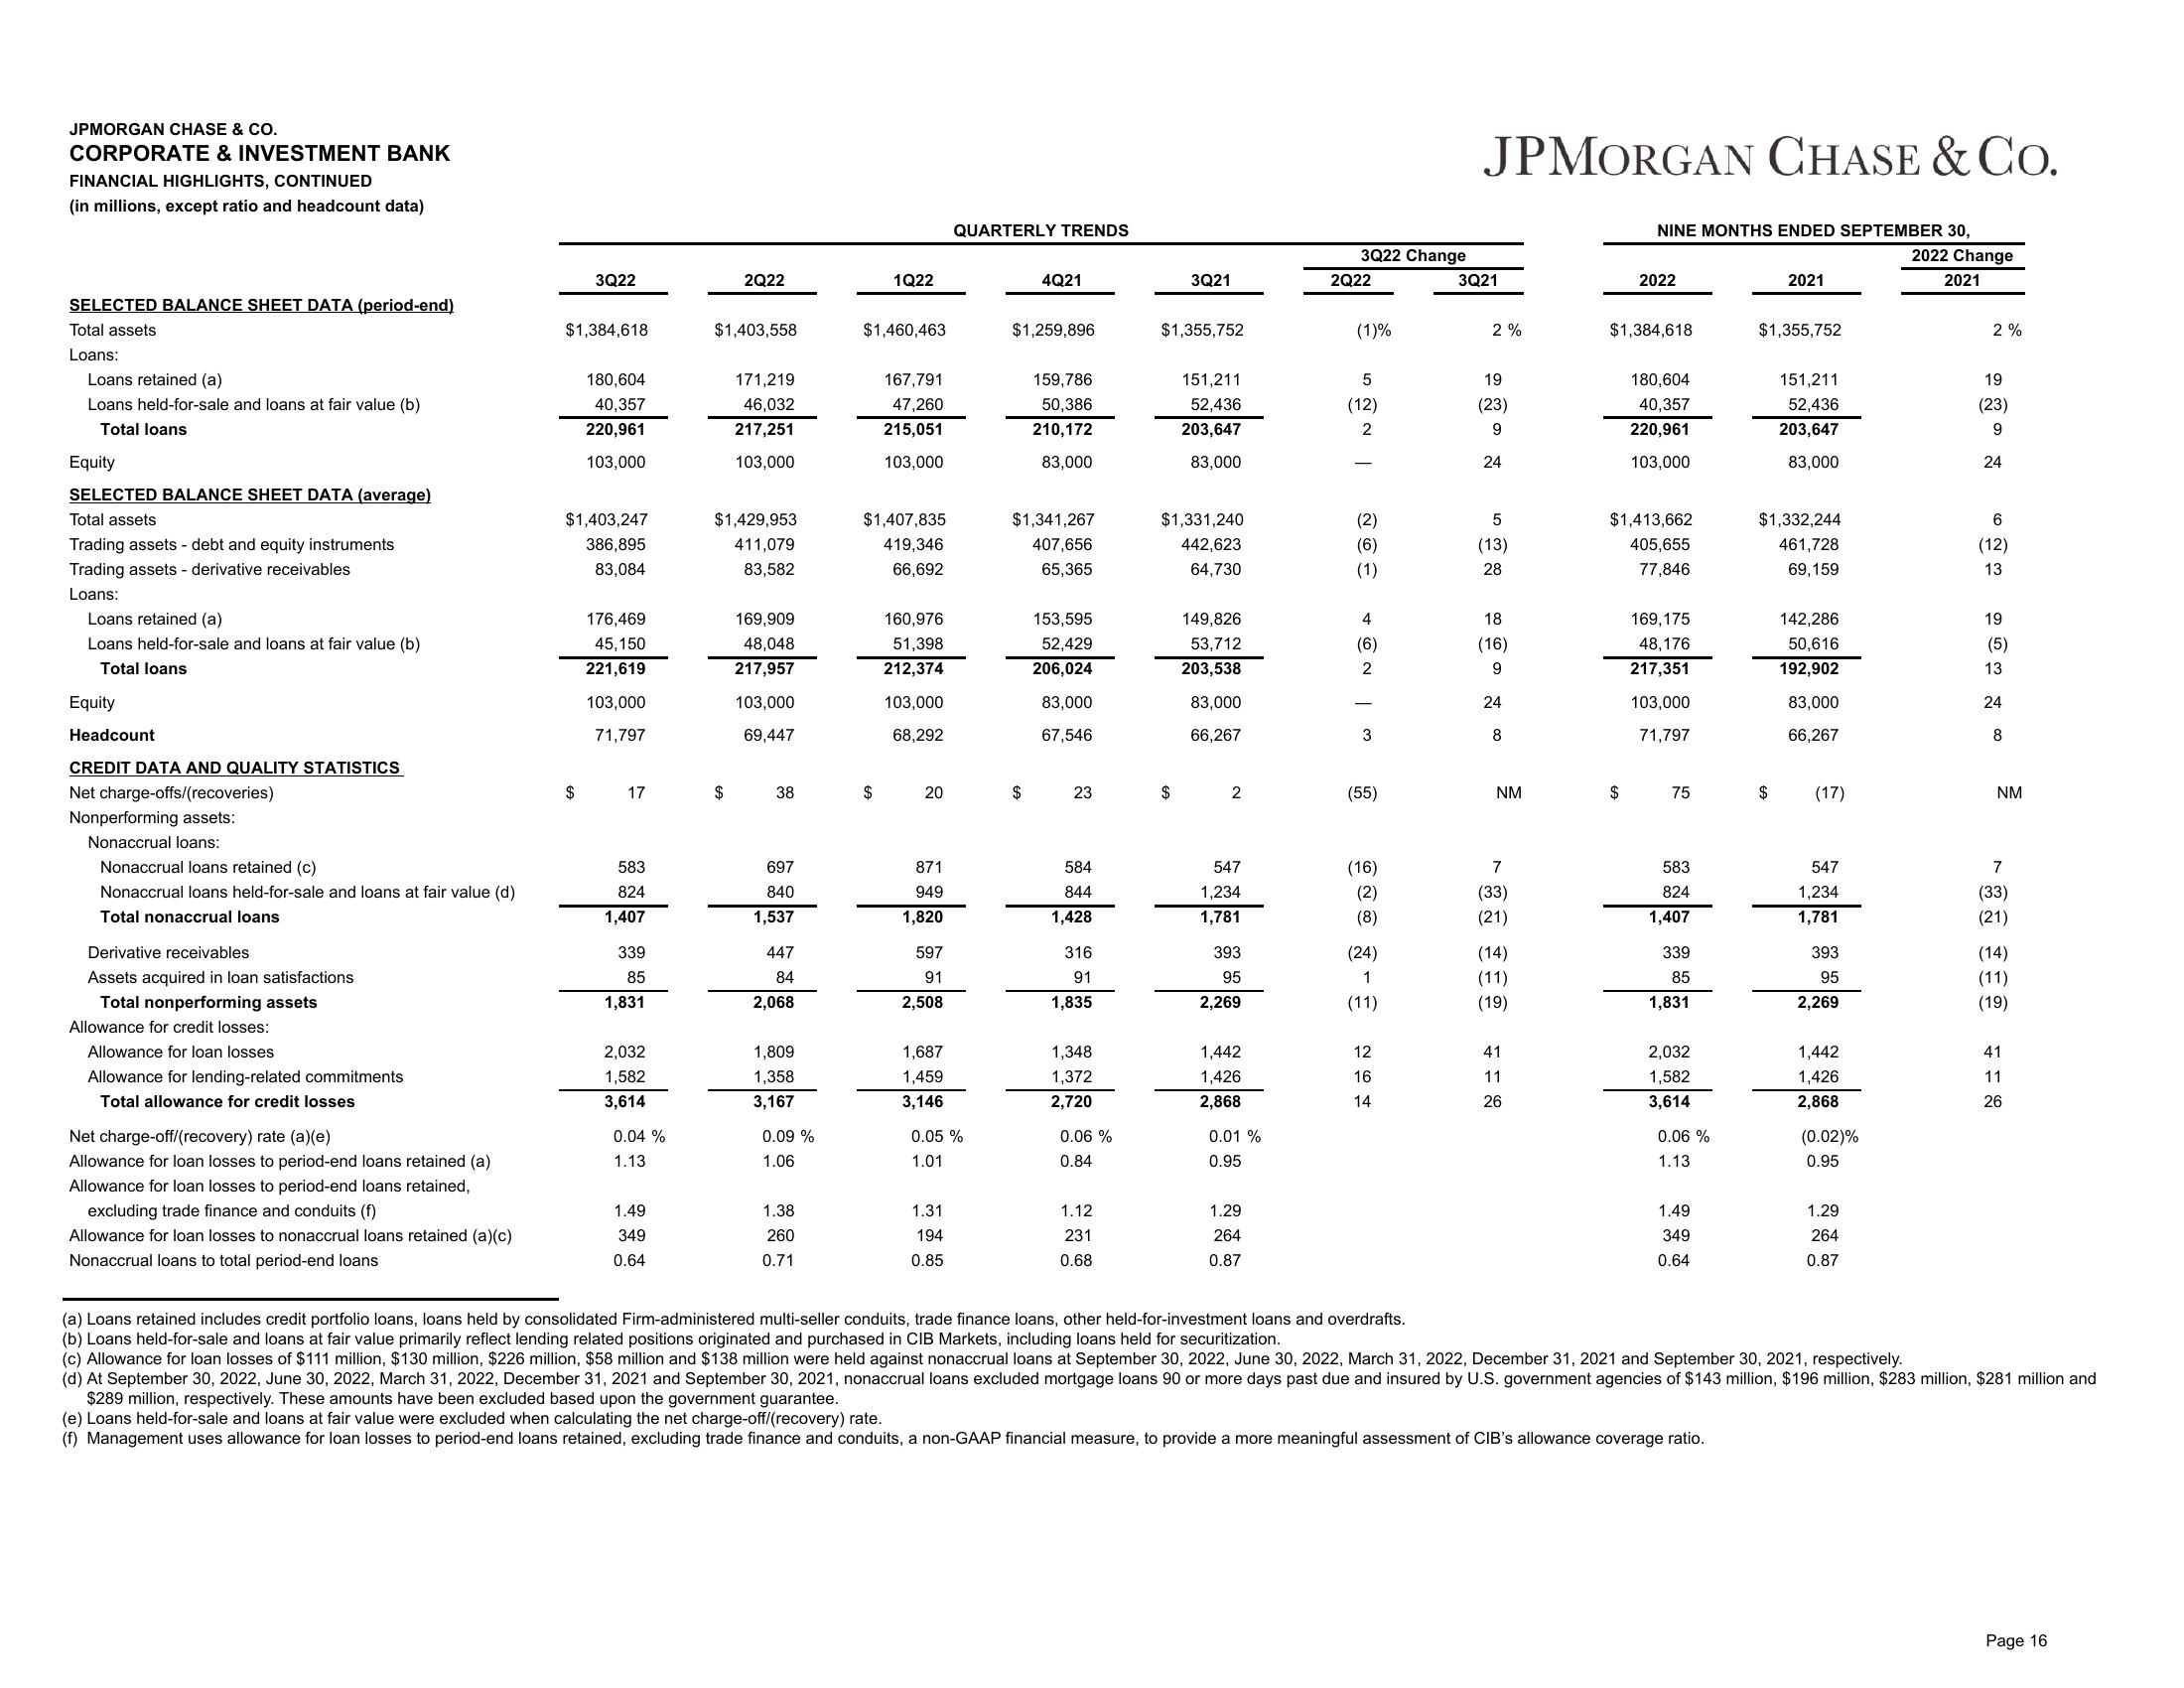
CORPORATE & INVESTMENT BANK
FINANCIAL HIGHLIGHTS, CONTINUED
(in millions, except ratio and headcount data)
SELECTED BALANCE SHEET DATA (period-end)
Total assets
Loans:
Loans retained (a)
Loans held-for-sale and loans at fair value (b)
Total loans
Equity
SELECTED BALANCE SHEET DATA (average)
Total assets
Trading assets - debt and equity instruments
Trading assets - derivative receivables
Loans:
Loans retained (a)
Loans held-for-sale and loans at fair value (b)
Total loans
Equity
Headcount
CREDIT DATA AND QUALITY STATISTICS
Net charge-offs/(recoveries)
Nonperforming assets:
Nonaccrual loans:
Nonaccrual loans retained (c)
Nonaccrual loans held-for-sale and loans at fair value (d)
Total nonaccrual loans
Derivative receivables
Assets acquired in loan satisfactions
Total nonperforming assets
Allowance for credit losses:
Allowance for loan losses
Allowance for lending-related commitments
Total allowance for credit losses
Net charge-off/(recovery) rate (a)(e)
Allowance for loan losses to period-end loans retained (a)
Allowance for loan losses to period-end loans retained,
excluding trade finance and conduits (f)
Allowance for loan losses to nonaccrual loans retained (a)(c)
Nonaccrual loans to total period-end loans
3Q22
$1,384,618
180,604
40,357
220,961
103,000
$1,403,247
386,895
83,084
176,469
45,150
221,619
103,000
71,797
$ 17
583
824
1,407
339
85
1,831
2,032
1,582
3,614
0.04 %
1.13
1.49
349
0.64
2Q22
$1,403,558
$
171,219
46,032
217,251
103,000
$1,429,953
411,079
83,582
169,909
48,048
217,957
103,000
69,447
38
697
840
1,537
447
84
2,068
1,809
1,358
3,167
0.09 %
1.06
1.38
260
0.71
1Q22
$1,460,463
$
167,791
47,260
215,051
103,000
$1,407,835
419,346
66,692
160,976
51,398
212,374
103,000
68,292
20
871
949
1,820
597
91
2,508
1,687
1,459
3,146
QUARTERLY TRENDS
0.05%
1.01
1.31
194
0.85
4Q21
$1,259,896
$
159,786
50,386
210,172
83,000
$1,341,267
407,656
65,365
153,595
52,429
206,024
83,000
67,546
23
584
844
1,428
316
91
1,835
1,348
1,372
2,720
0.06 %
0.84
1.12
231
0.68
3Q21
$1,355,752
$
151,211
52,436
203,647
83,000
$1,331,240
442,623
64,730
149,826
53,712
203,538
83,000
66,267
2
547
1,234
1,781
393
95
2,269
1,442
1,426
2,868
0.01 %
0.95
1.29
264
0.87
3Q22 Change
2Q22
(1)%
5
(12)
2
(2)
(6)
(1)
4
(6)
2
3
(55)
(16)
(2)
(8)
(24)
1
(11)
12
16
14
JPMORGAN CHASE & CO.
3Q21
2%
19
(23)
9
24
5
(13)
28
18
(16)
9
24
8
NM
7
(33)
(21)
(14)
(11)
(19)
41
11
26
NINE MONTHS ENDED SEPTEMBER 30,
2022
$1,384,618
$
180,604
40,357
220,961
103,000
$1,413,662
405,655
77,846
169, 175
48,176
217,351
103,000
71,797
75
583
824
1,407
339
85
1,831
2,032
1,582
3,614
0.06 %
1.13
1.49
349
0.64
2021
$1,355,752
$
151,211
52,436
203,647
83,000
$1,332,244
461,728
69,159
142,286
50,616
192,902
83,000
66,267
(17)
547
1,234
1,781
393
95
2,269
1,442
1,426
2,868
(0.02)%
0.95
1.29
264
0.87
2022 Change
2021
2%
19
(23)
9
24
6
(12)
13
19
(5)
13
24
8
NM
7
(33)
(21)
(14)
(11)
(19)
41
11
26
(a) Loans retained includes credit portfolio loans, loans held by consolidated Firm-administered multi-seller conduits, trade finance loans, other held-for-investment loans and overdrafts.
(b) Loans held-for-sale and loans at fair value primarily reflect lending related positions originated and purchased in CIB Markets, including loans held for securitization.
(c) Allowance for loan losses of $111 million, $130 million, $226 million, $58 million and $138 million were held against nonaccrual loans at September 30, 2022, June 30, 2022, March 31, 2022, December 31, 2021 and September 30, 2021, respectively.
(d) At September 30, 2022, June 30, 2022, March 31, 2022, December 31, 2021 and September 30, 2021, nonaccrual loans excluded mortgage loans 90 or more days past due and insured by U.S. government agencies of $143 million, $196 million, $283 million, $281 million and
$289 million, respectively. These amounts have been excluded based upon the government guarantee.
(e) Loans held-for-sale and loans at fair value were excluded when calculating the net charge-off/(recovery) rate.
(f) Management uses allowance for loan losses to period-end loans retained, excluding trade finance and conduits, a non-GAAP financial measure, to provide a more meaningful assessment of CIB's allowance coverage ratio.
Page 16View entire presentation