Wirecard Results Presentation Deck
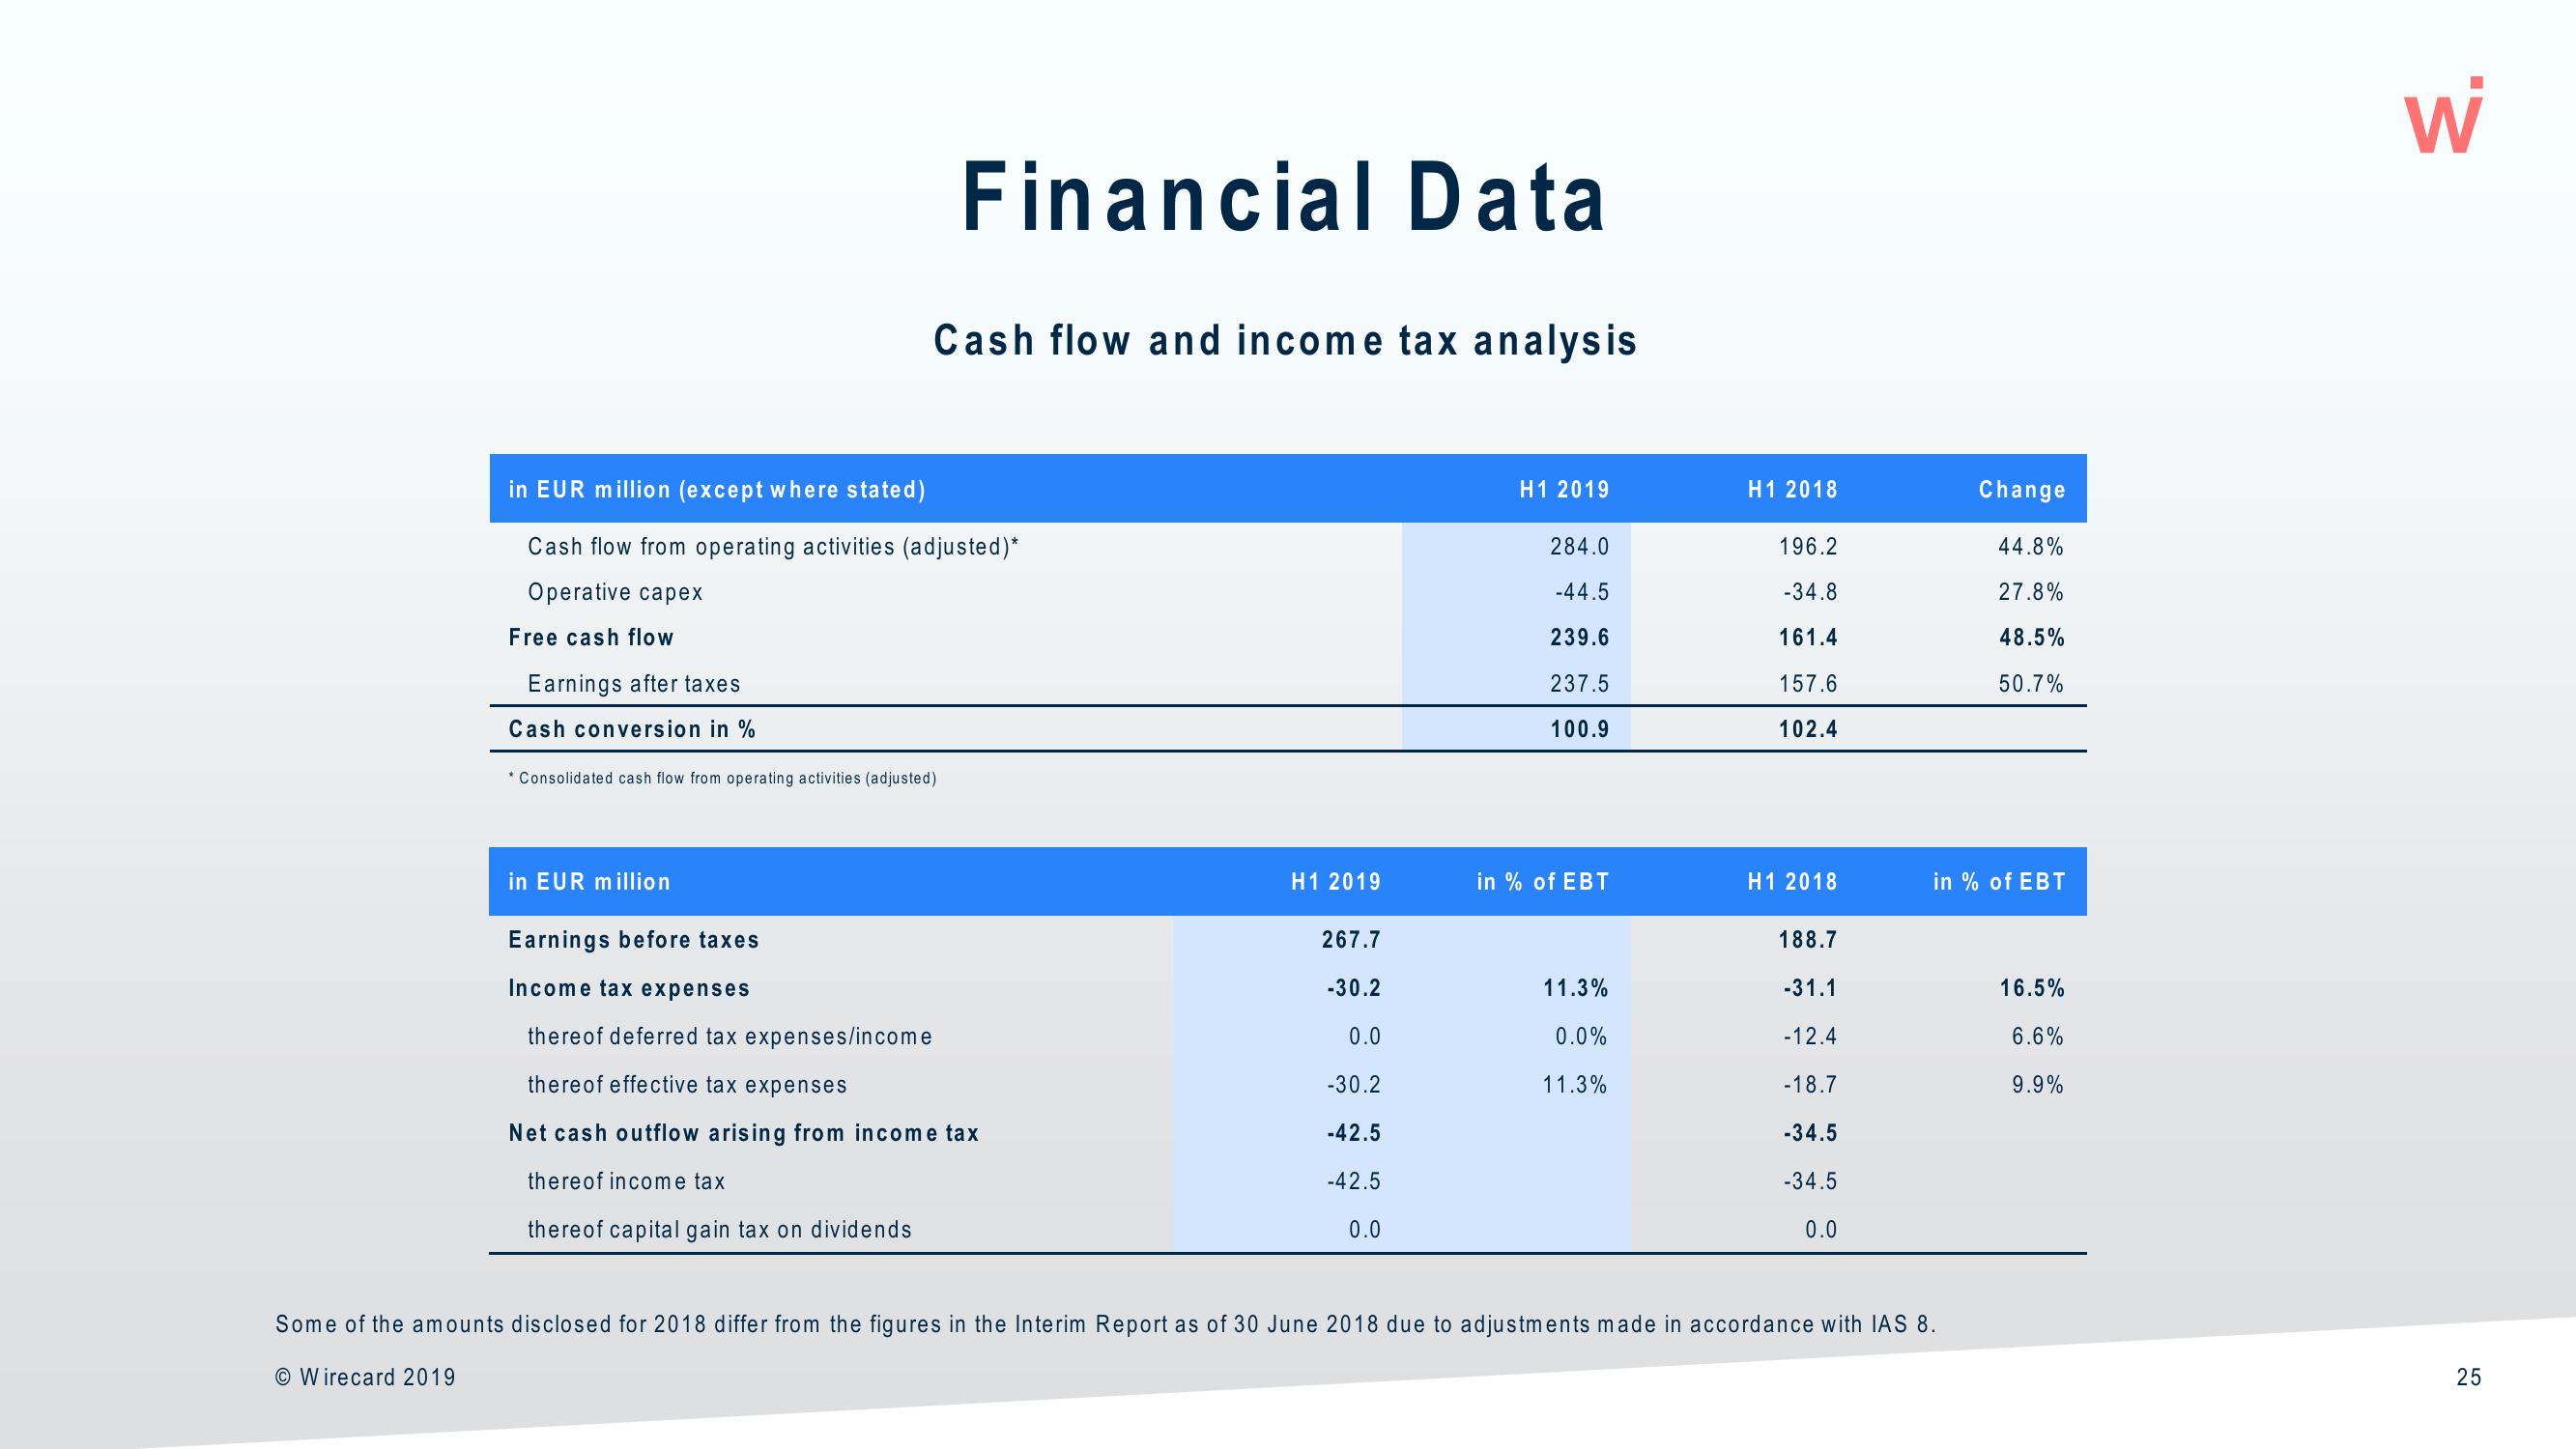
Financial Data
Cash flow and income tax analysis
in EUR million (except where stated)
Cash flow from operating activities (adjusted)*
Operative capex
Free cash flow
Earnings after taxes
Cash conversion in %
* Consolidated cash flow from operating activities (adjusted)
in EUR million
Earnings before taxes
Income tax expenses
there of deferred tax expenses/income
thereof effective tax expenses
Net cash outflow arising from income tax
thereof income tax
thereof capital gain tax on dividends
H1 2019
267.7
-30.2
0.0
-30.2
-42.5
-42.5
0.0
H1 2019
284.0
-44.5
239.6
237.5
100.9
in % of EBT
11.3%
0.0%
11.3%
H1 2018
196.2
-34.8
161.4
157.6
102.4
H1 2018
188.7
-31.1
-12.4
-18.7
-34.5
-34.5
0.0
Change
Some of the amounts disclosed for 2018 differ from the figures in the Interim Report as of 30 June 2018 due to adjustments made in accordance with IAS 8.
O Wirecard 2019
44.8%
27.8%
48.5%
50.7%
in % of EBT
16.5%
6.6%
9.9%
W
25View entire presentation