Hypebeast SPAC Presentation Deck
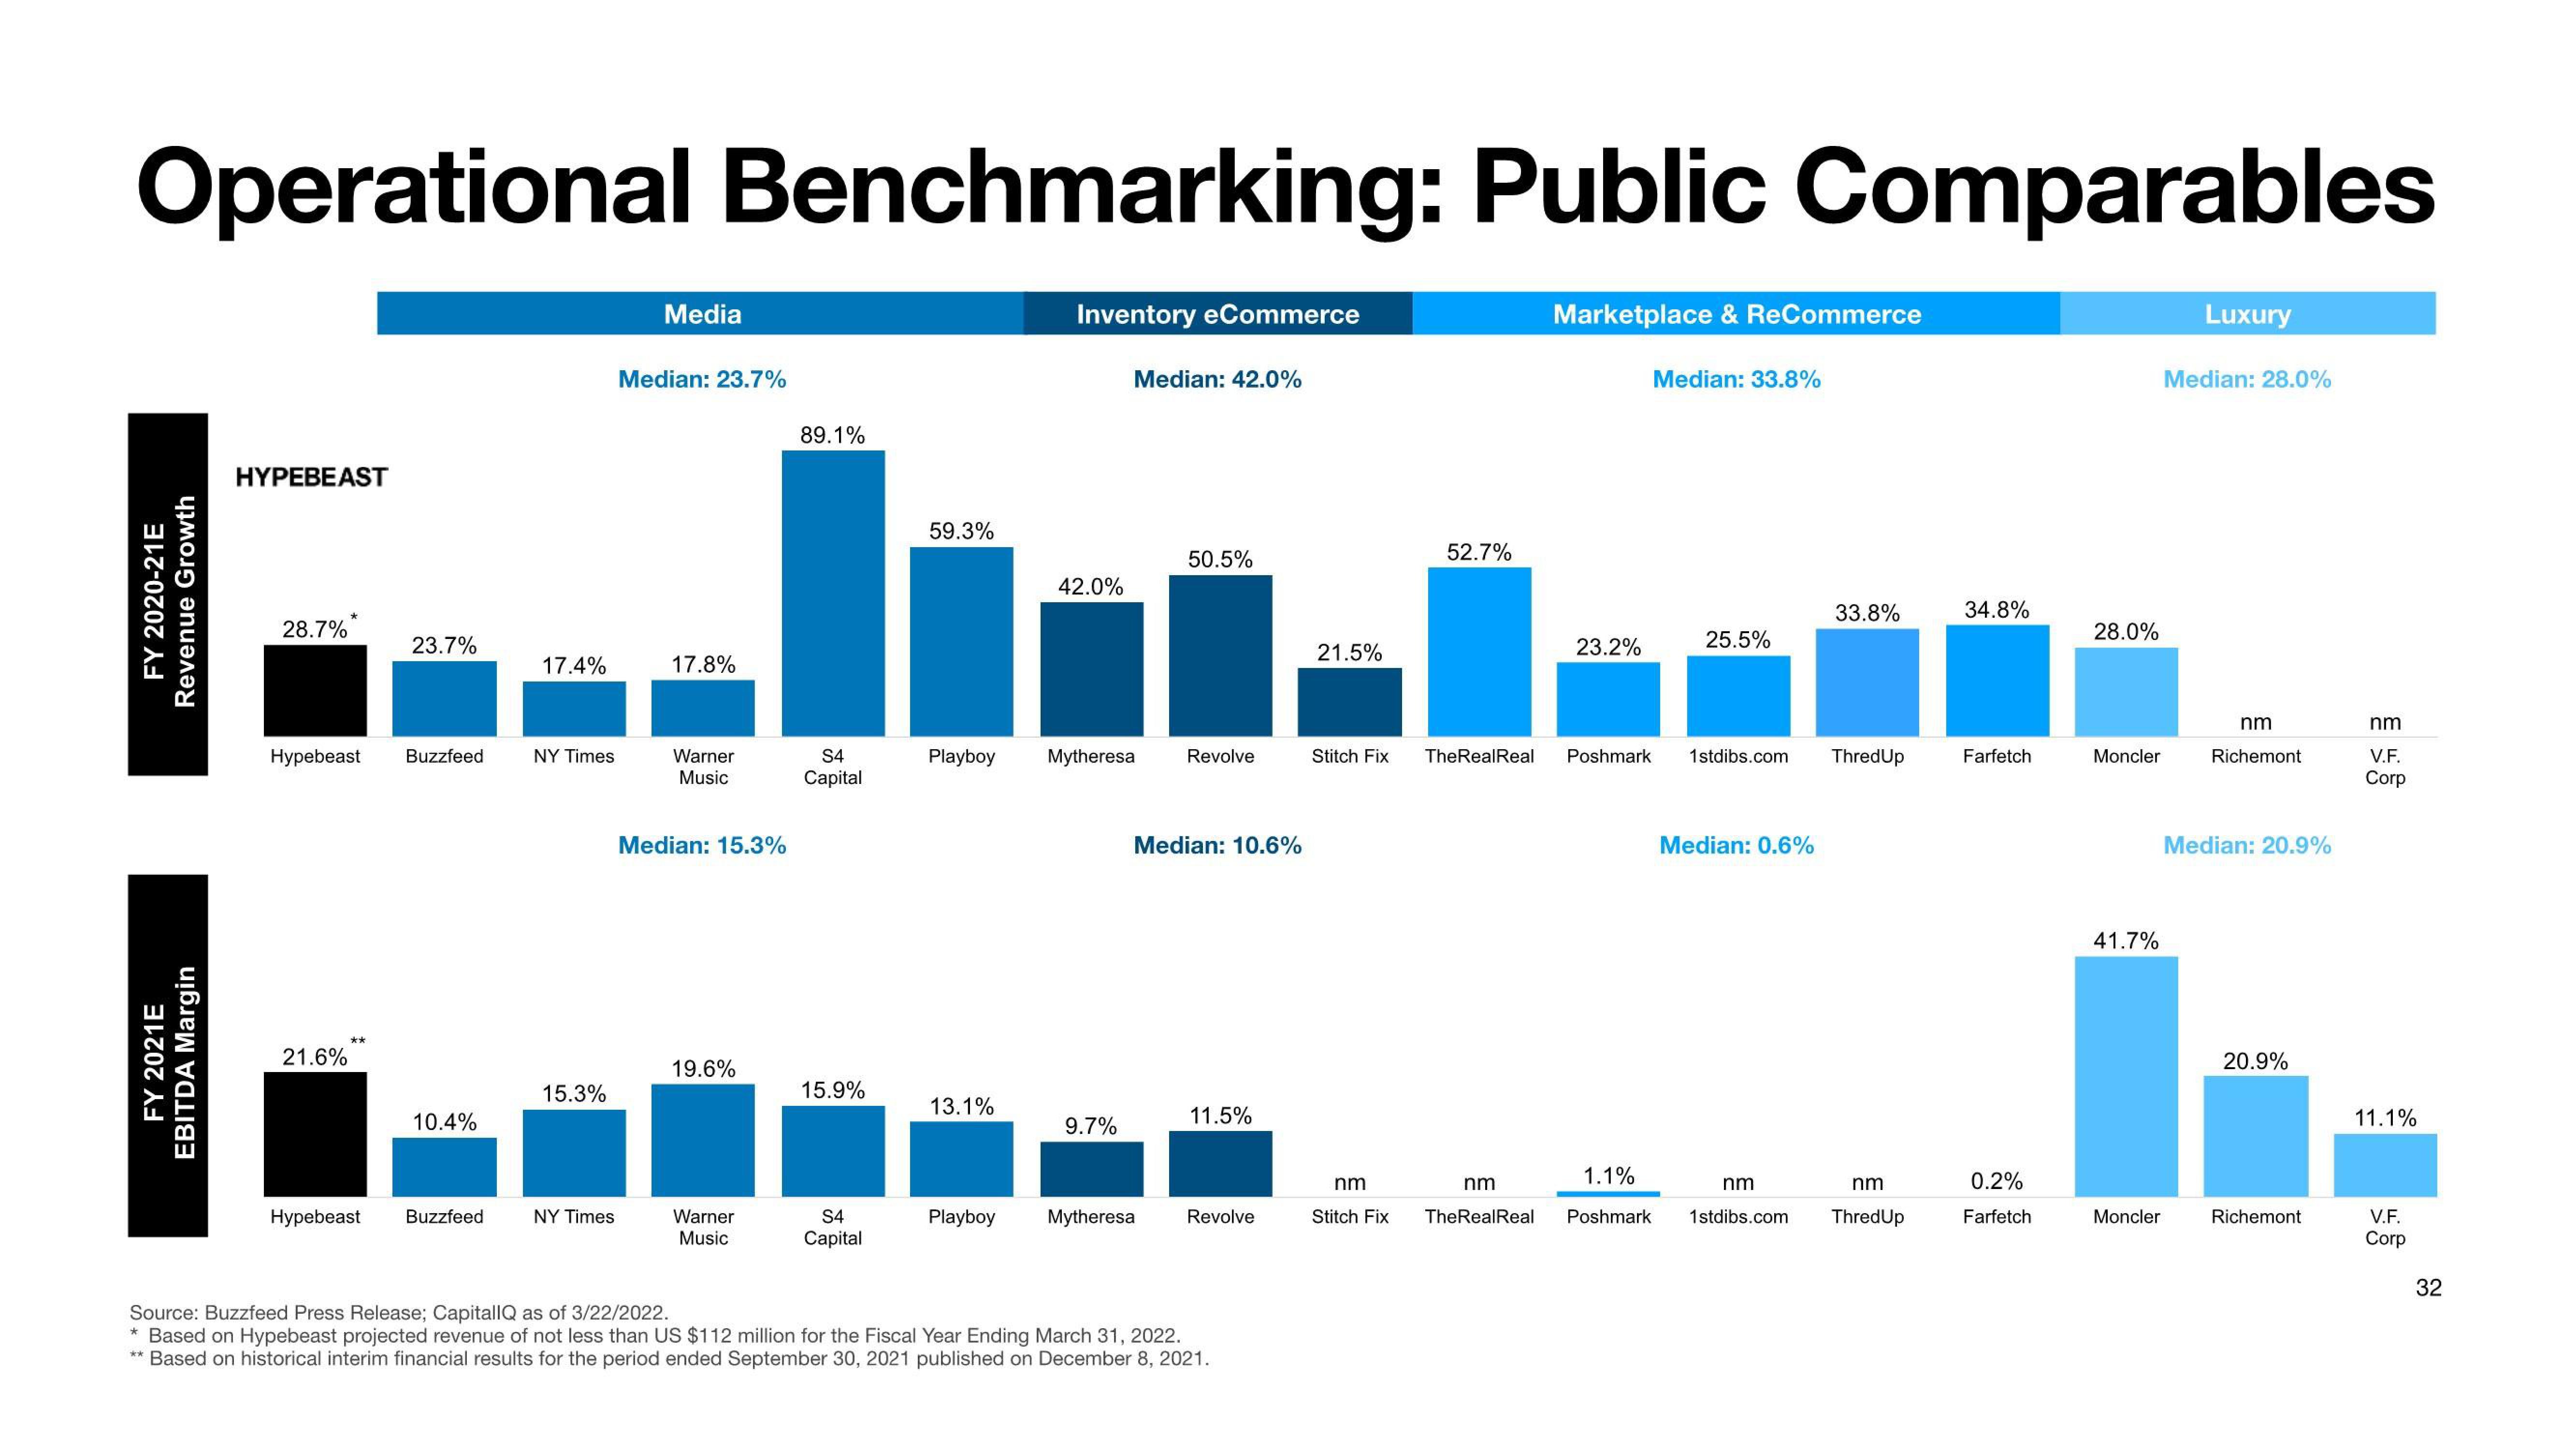
Operational Benchmarking: Public Comparables
FY 2020-21E
Revenue Growth
FY 2021E
EBITDA Margin
HYPEBEAST
28.7%
Hypebeast Buzzfeed
21.6%
23.7%
Hypebeast
10.4%
17.4%
NY Times
15.3%
Buzzfeed NY Times
Media
Median: 23.7%
17.8%
Warner
Music
Median: 15.3%
19.6%
Warner
Music
89.1%
S4
Capital
15.9%
S4
Capital
59.3%
Playboy
13.1%
Inventory eCommerce
42.0%
Median: 42.0%
Mytheresa
9.7%
50.5%
Playboy Mytheresa
Revolve
Median: 10.6%
11.5%
Revolve
Source: Buzzfeed Press Release; CapitallQ as of 3/22/2022.
* Based on Hypebeast projected revenue of not less than US $112 million for the Fiscal Year Ending March 31, 2022.
** Based on historical interim financial results for the period ended September 30, 2021 published on December 8, 2021.
21.5%
52.7%
Stitch Fix TheRealReal
Marketplace & ReCommerce
23.2%
Median: 33.8%
25.5%
33.8%
Poshmark 1stdibs.com ThredUp
Median: 0.6%
1.1%
nm
nm
nm
nm
Stitch Fix TheRealReal Poshmark 1stdibs.com ThredUp
34.8%
Farfetch
0.2%
Farfetch
28.0%
Moncler
41.7%
Moncler
Luxury
Median: 28.0%
nm
Richemont
Median: 20.9%
20.9%
Richemont
nm
V.F.
Corp
11.1%
V.F.
Corp
32View entire presentation