Snap Inc Investor Presentation Deck
Snap Inc.
in millions
YoY
Change
$825
2017
104%
23%
2017
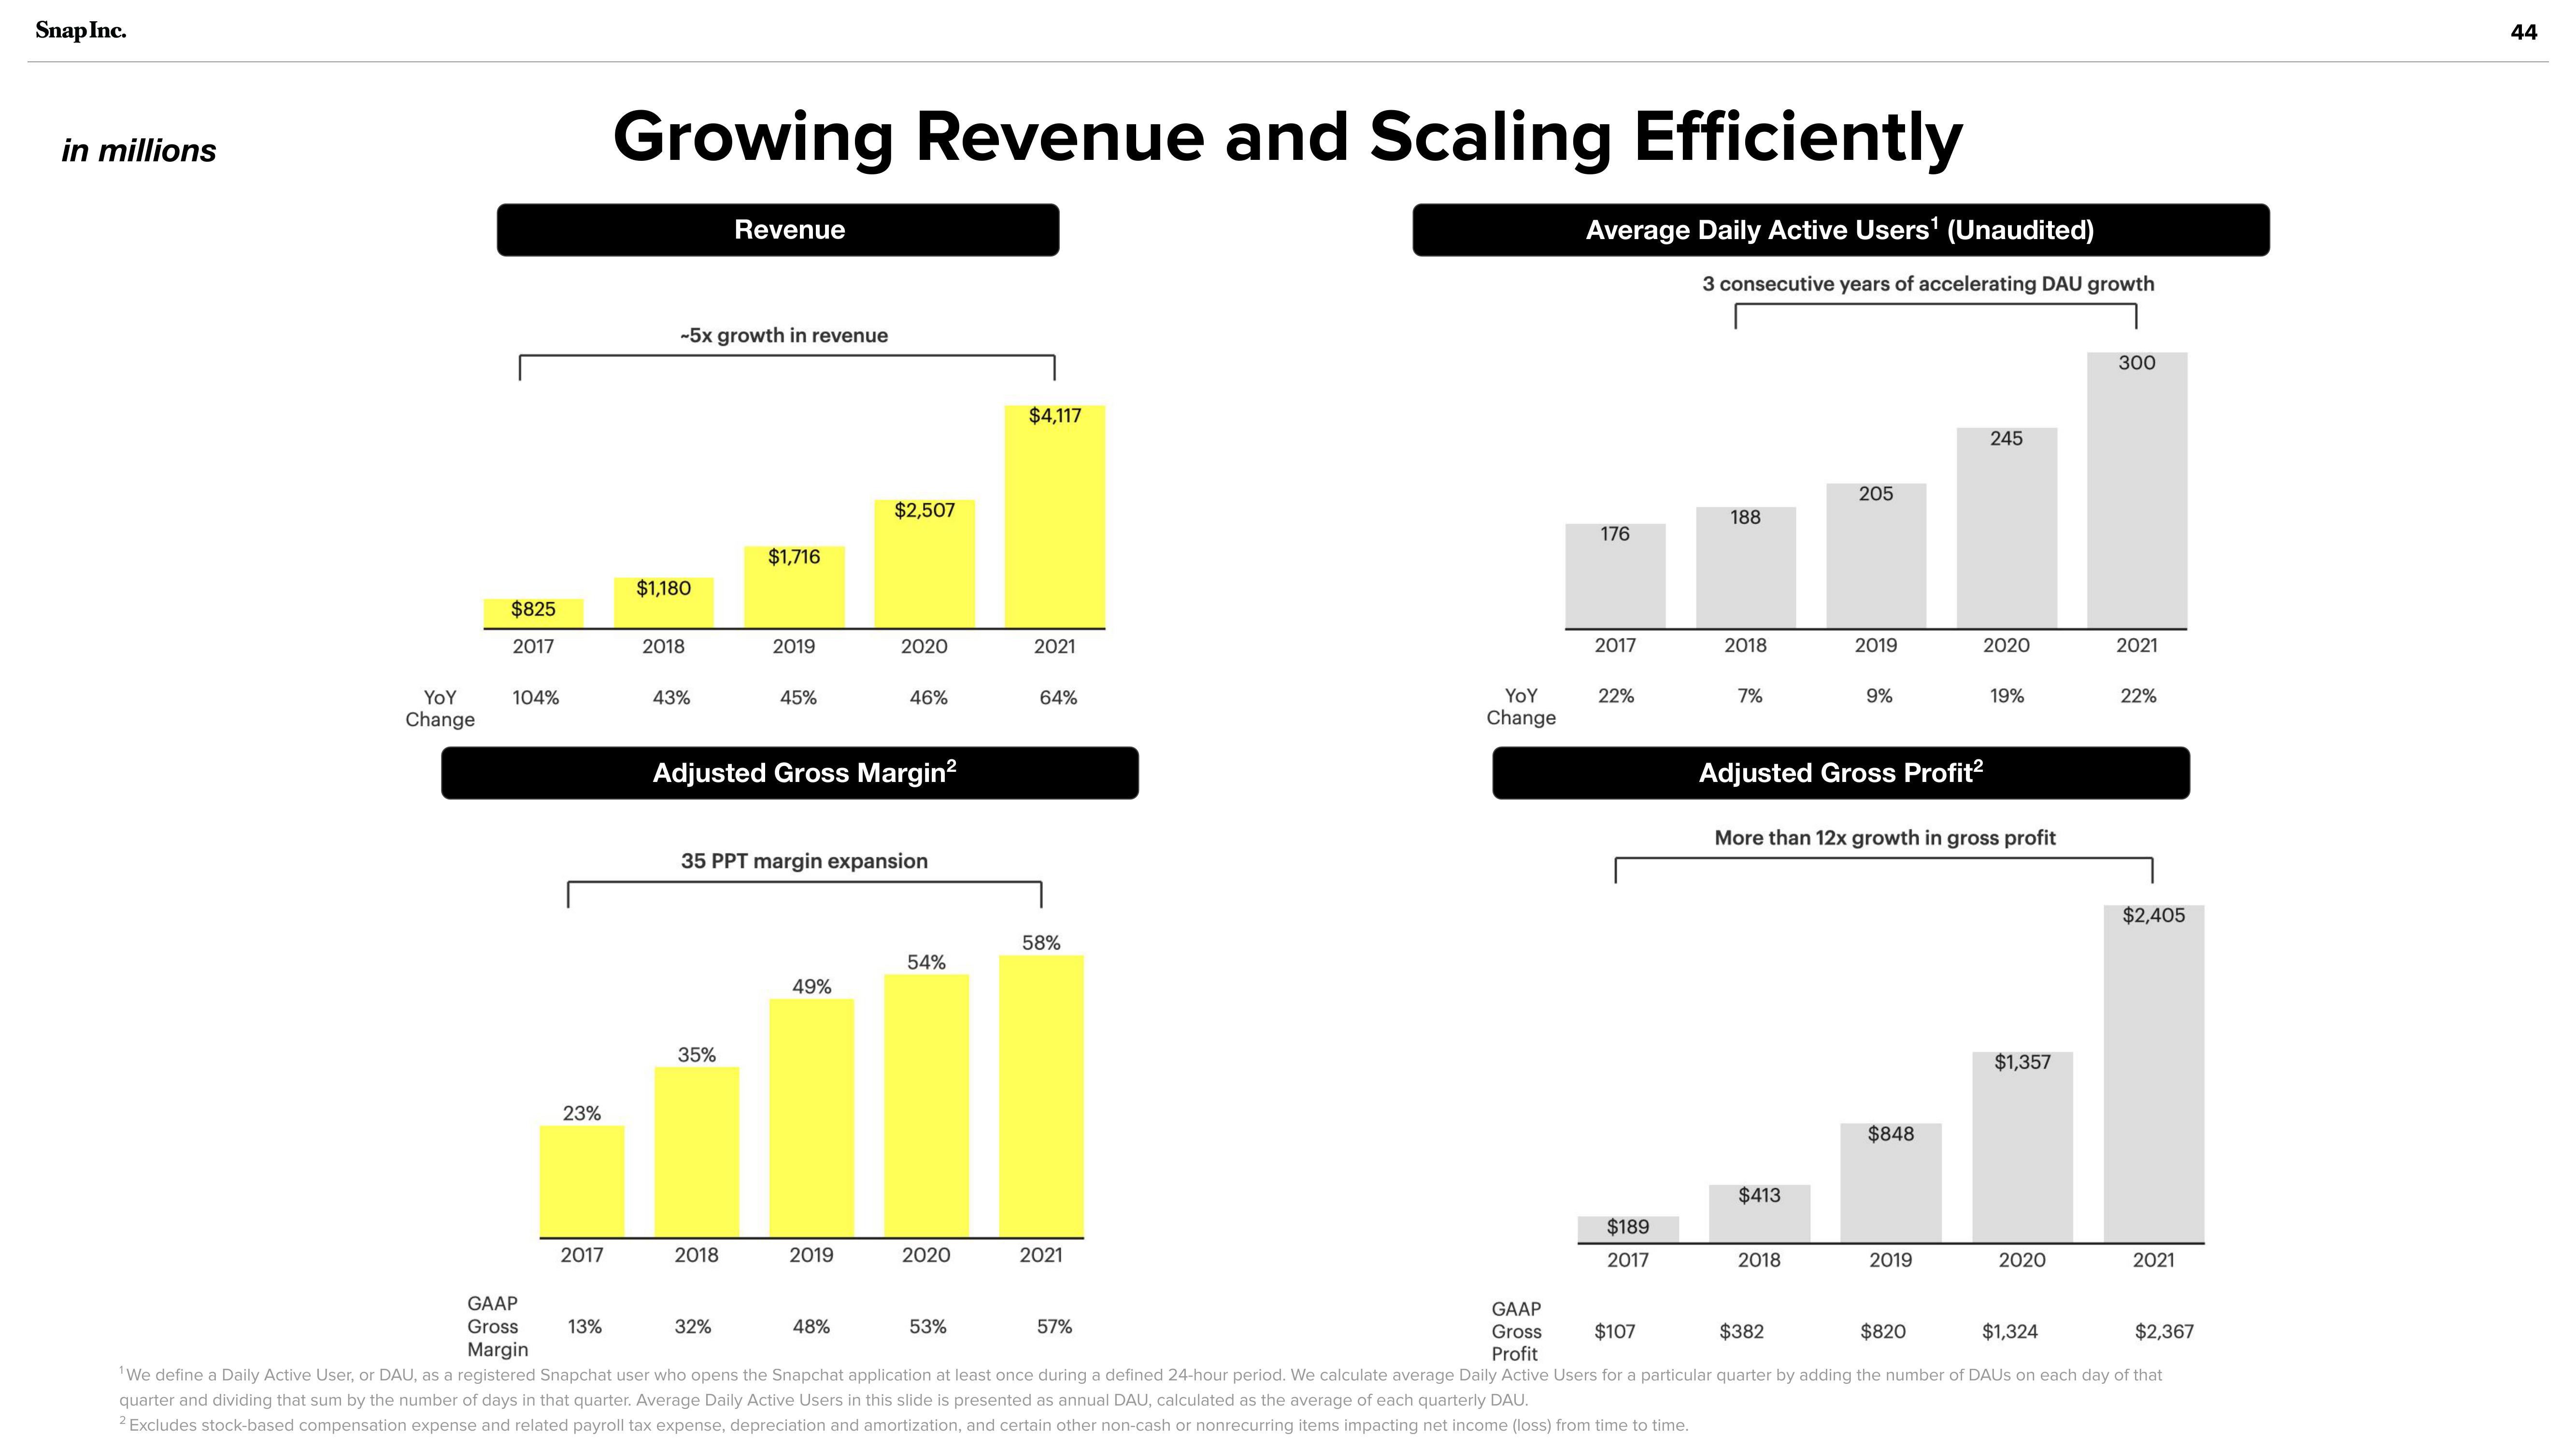
Growing Revenue and Scaling Efficiently
Average Daily Active Users¹ (Unaudited)
13%
-5x growth in revenue
$1,180
2018
43%
Revenue
35%
2018
$1,716
2019
32%
45%
Adjusted Gross Margin²
35 PPT margin expansion
49%
$2,507
2019
2020
46%
48%
54%
2020
$4,117
53%
2021
64%
58%
2021
YOY
Change
57%
176
2017
22%
$189
2017
3 consecutive years of accelerating DAU growth
188
2018
7%
$413
205
2018
2019
9%
Adjusted Gross Profit²
More than 12x growth in gross profit
$848
245
2019
2020
19%
$1,357
2020
300
GAAP
Gross
Margin
GAAP
Gross
Profit
$107
$382
$820
$1,324
$2,367
¹We define a Daily Active User, or DAU, as a registered Snapchat user who opens the Snapchat application at least once during a defined 24-hour period. We calculate average Daily Active Users for a particular quarter by adding the number of DAUS on each day of that
quarter and dividing that sum by the number of days in that quarter. Average Daily Active Users in this slide is presented as annual DAU, calculated as the average of each quarterly DAU.
2 Excludes stock-based compensation expense and related payroll tax expense, depreciation and amortization, and certain other non-cash or nonrecurring items impacting net income (loss) from time to time.
2021
22%
$2,405
2021
44View entire presentation