Kinnevik Results Presentation Deck
Intro
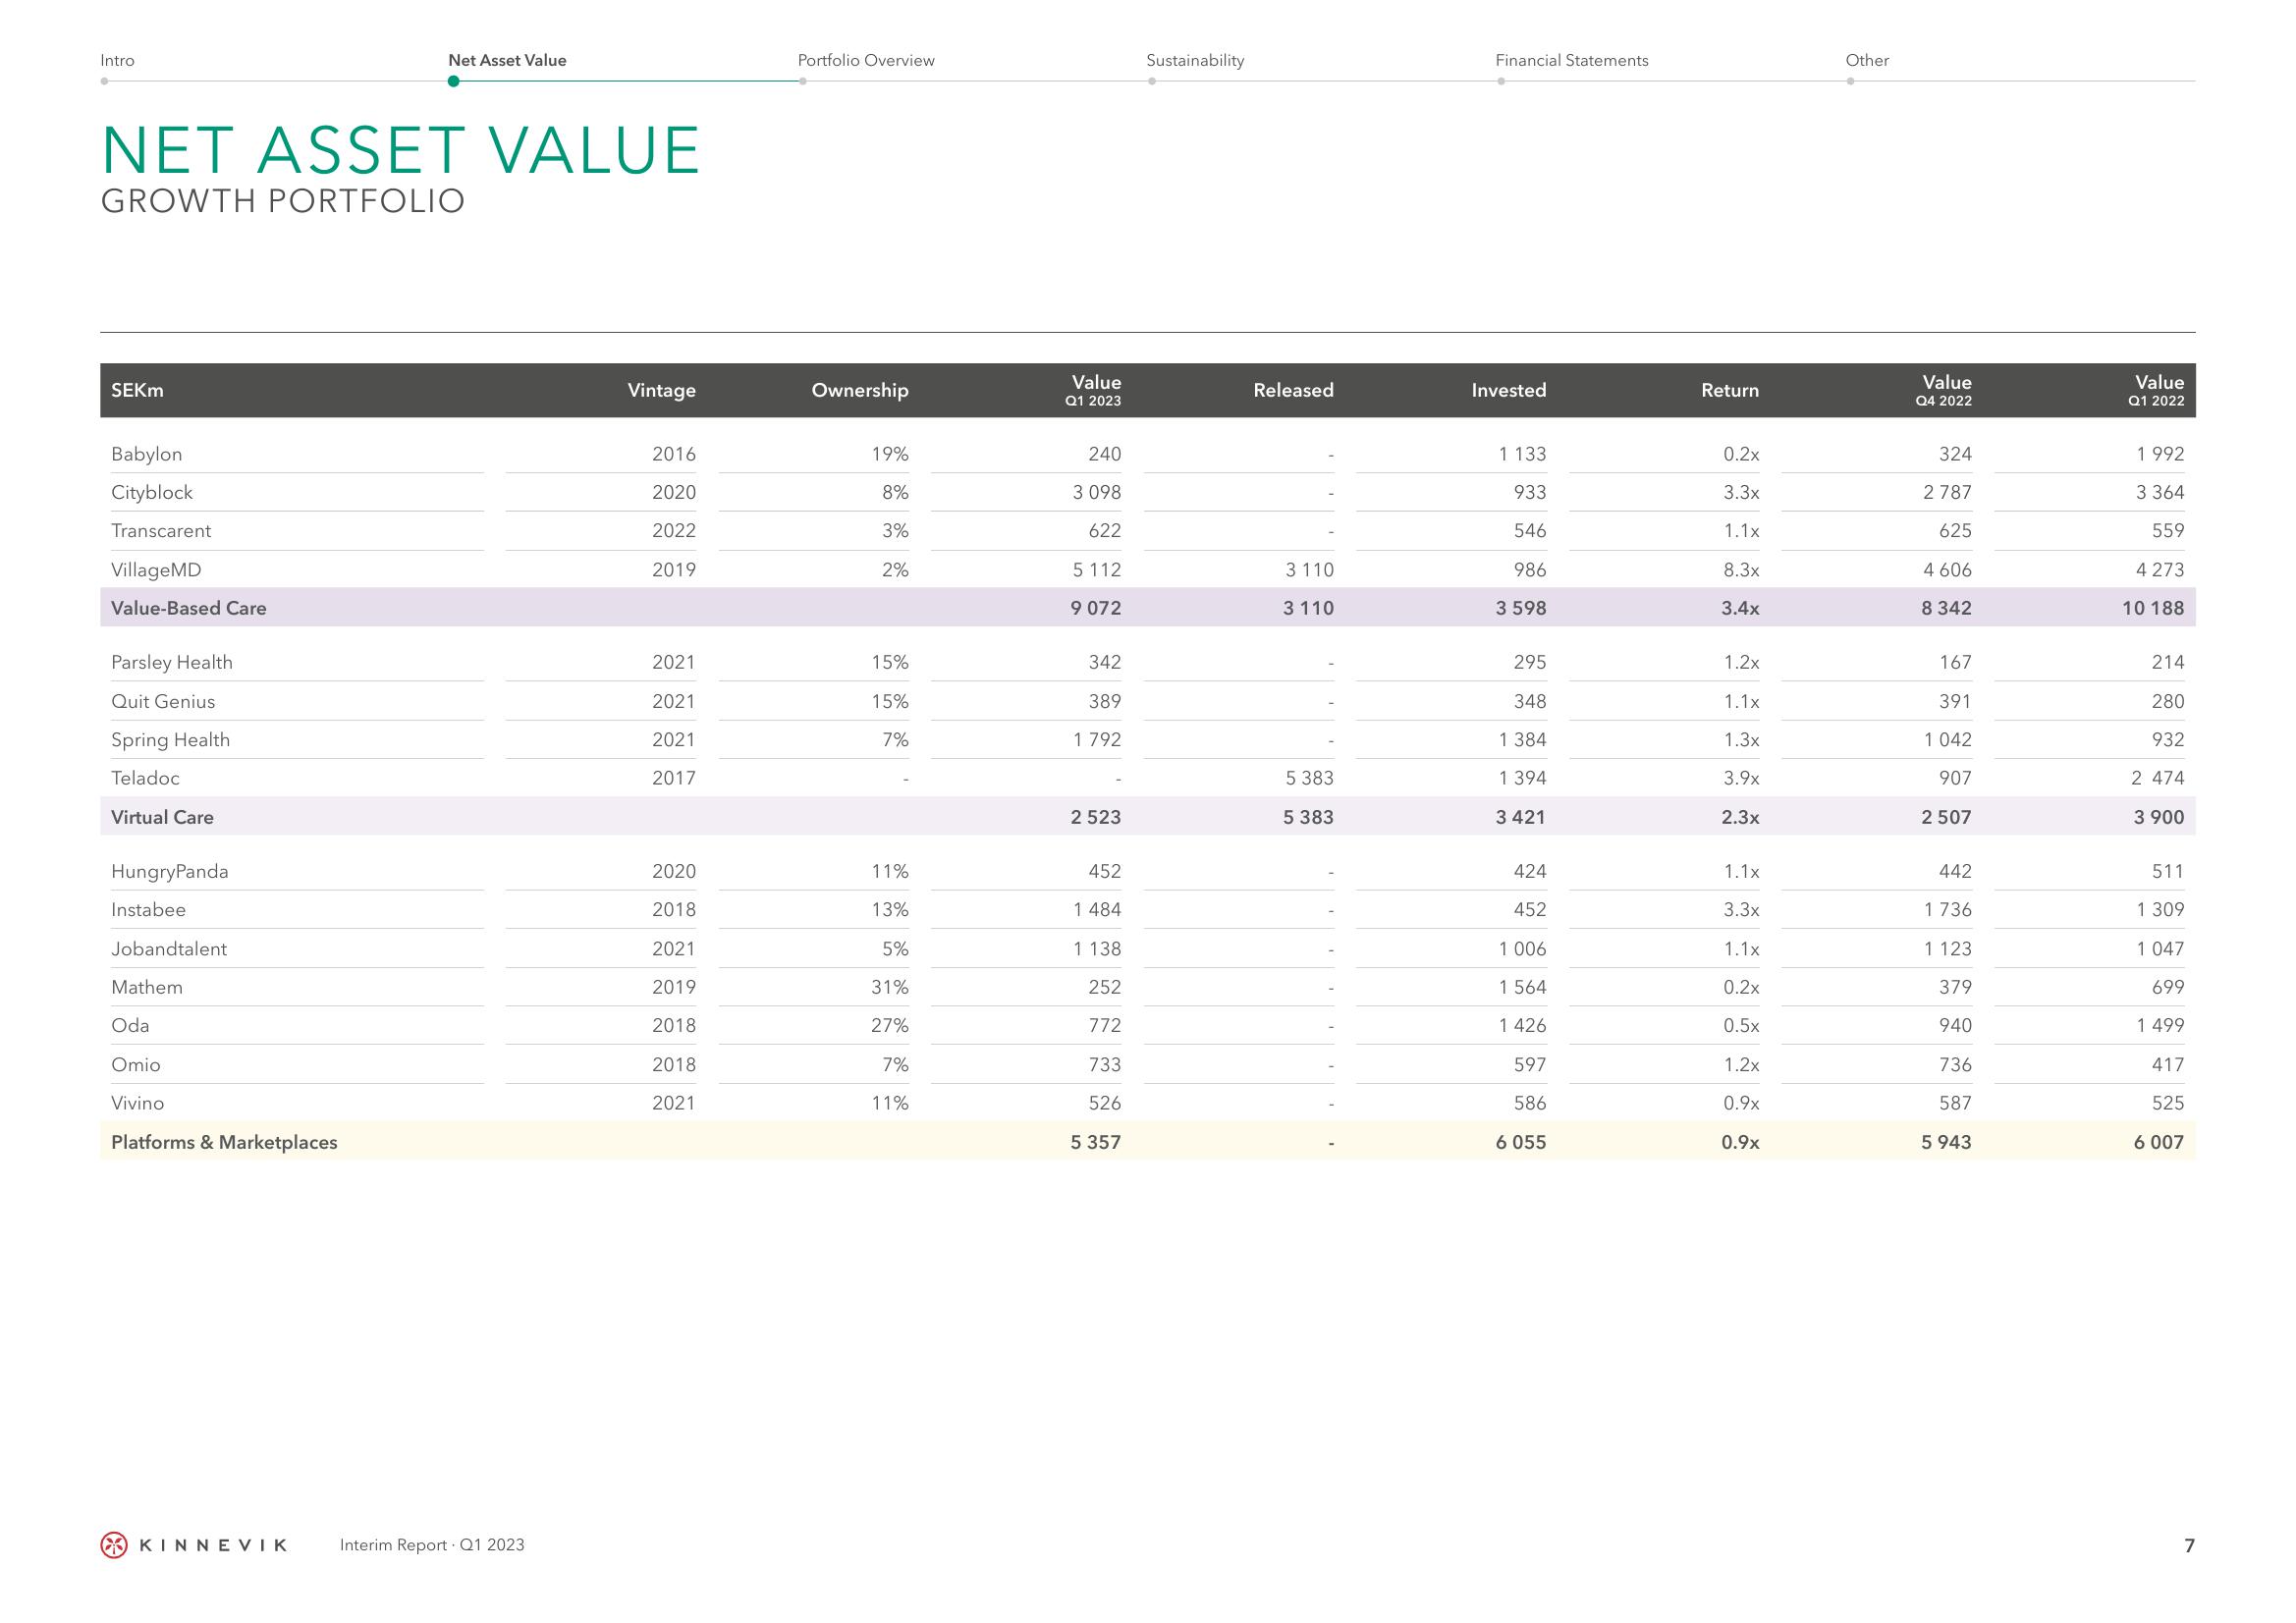
NET ASSET VALUE
GROWTH PORTFOLIO
SEKM
Babylon
Cityblock
Transcarent
Village MD
Value-Based Care
Parsley Health
Quit Genius
Spring Health
Teladoc
Virtual Care
HungryPanda
Instabee
Jobandtalent
Mathem
Oda
Omio
Vivino
Platforms & Marketplaces
Net Asset Value
KINNEVIK
Interim Report Q1 2023
Vintage
2016
2020
2022
2019
2021
2021
2021
2017
2020
2018
2021
2019
2018
2018
2021
Portfolio Overview
Ownership
19%
8%
3%
2%
15%
15%
7%
11%
13%
5%
31%
27%
7%
11%
Value
Q1 2023
240
3 098
622
5112
9 072
342
389
1.792
2 523
452
1 484
1 138
252
772
733
526
5 357
Sustainability
Released
3 110
3 110
5 383
5 383
Financial Statements
Invested
1 133
933
546
986
3 598
295
348
1 384
1394
3 421
424
452
1 006
1 564
1426
597
586
6 055
Return
0.2x
3.3x
1.1x
8.3x
3.4x
1.2x
1.1x
1.3x
3.9x
2.3x
1.1x
3.3x
1.1x
0.2x
0.5x
1.2x
0.9x
0.9x
Other
Value
Q4 2022
324
2 787
625
4 606
8 342
167
391
1 042
907
2 507
442
1 736
1 123
379
940
736
587
5 943
Value
Q1 2022
1 992
3 364
559
4 273
10 188
214
280
932
2 474
3 900
511
1 309
1 047
699
1 499
417
525
6 007
7View entire presentation