Grab SPAC Presentation Deck
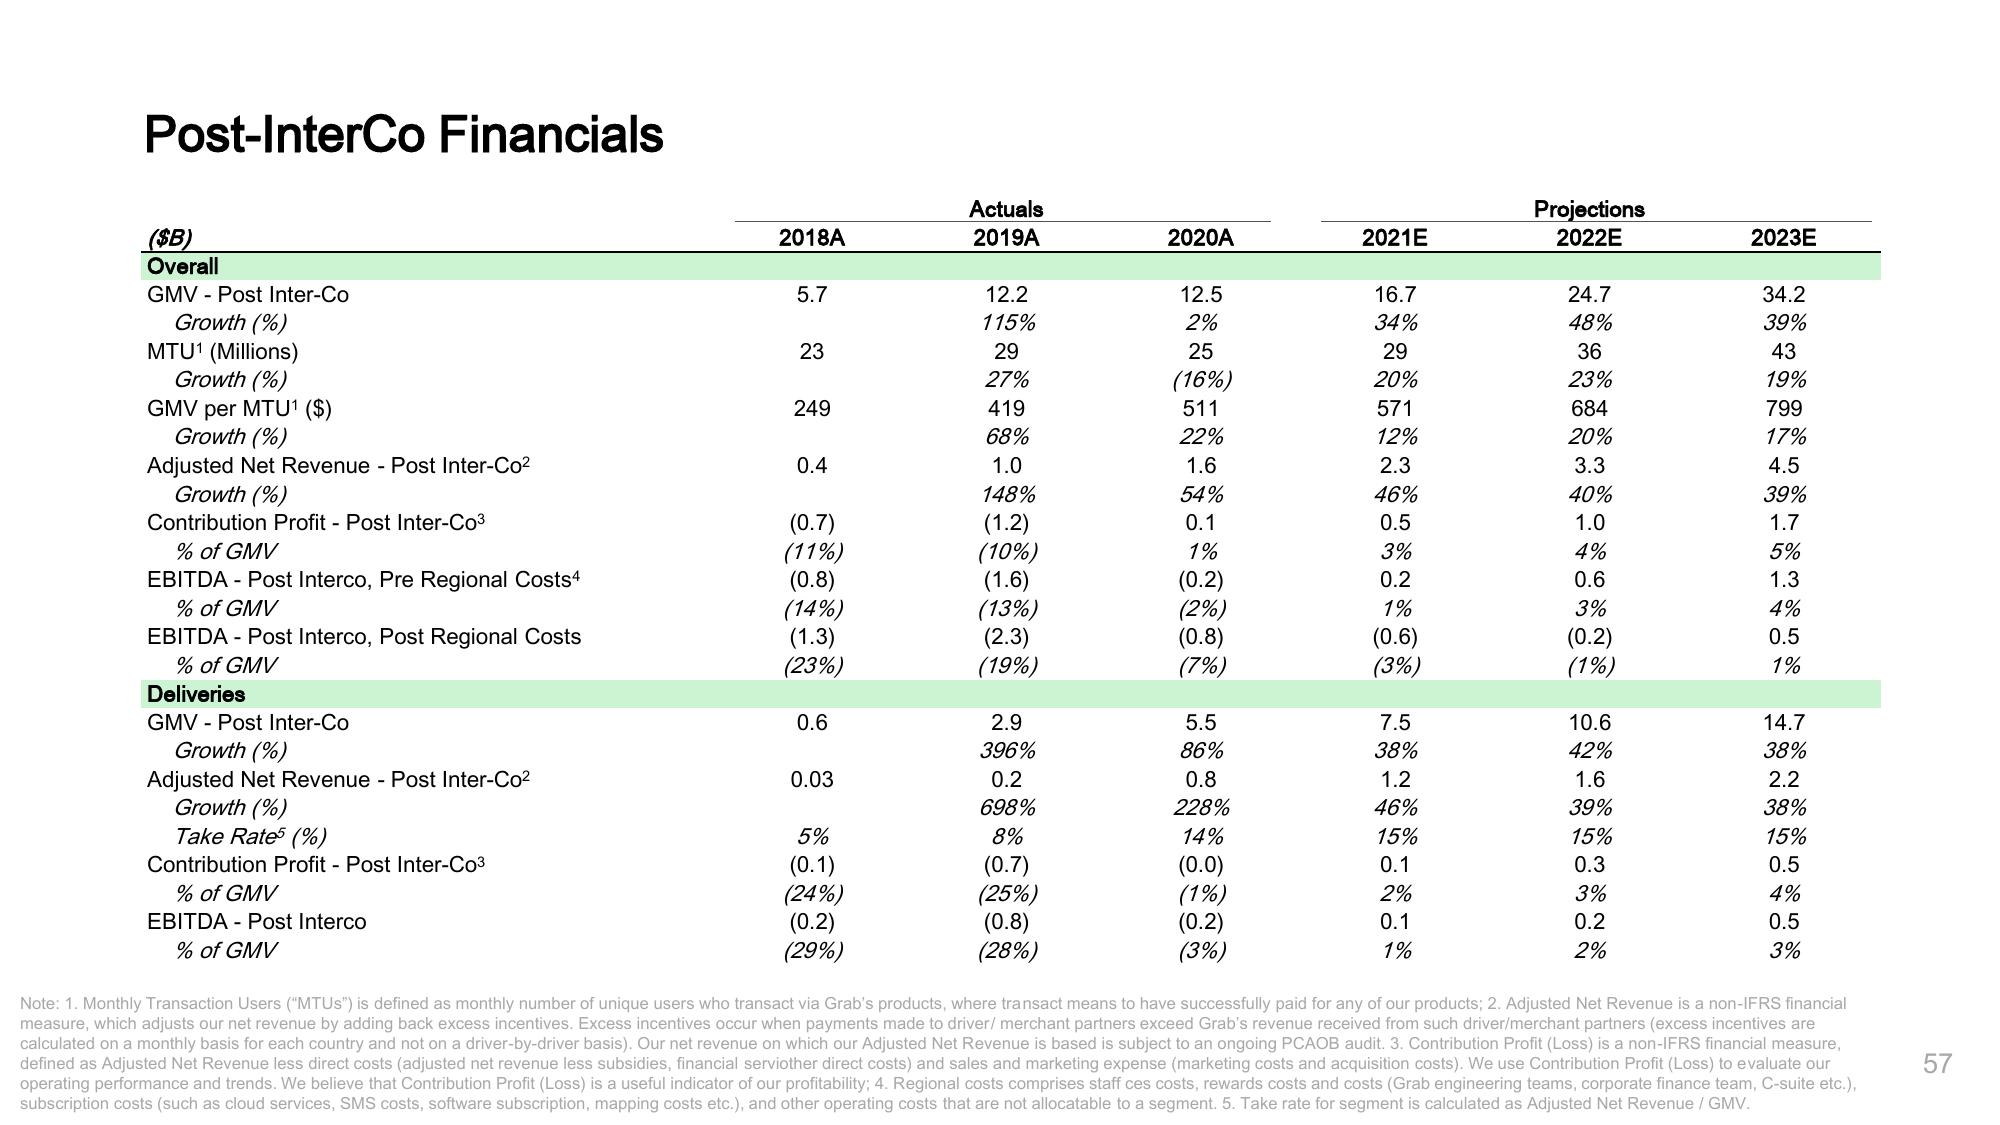
Post-InterCo Financials
($B)
Overall
GMV Post Inter-Co
Growth (%)
MTU¹ (Millions)
Growth (%)
GMV per MTU¹ ($)
Growth (%)
Adjusted Net Revenue - Post Inter-Co²
Growth (%)
Contribution Profit - Post Inter-Co³
% of GMV
EBITDA - Post Interco, Pre Regional Costs4
% of GMV
EBITDA - Post Interco, Post Regional Costs
% of GMV
Deliveries
GMV Post Inter-Co
Growth (%)
Adjusted Net Revenue - Post Inter-Co²
Growth (%)
Take Rates (%)
Contribution Profit - Post Inter-Co³
% of GMV
EBITDA - Post Interco
% of GMV
2018A
5.7
23
249
0.4
(0.7)
(11%)
(0.8)
(14%)
(1.3)
(23%)
0.6
0.03
5%
(0.1)
(24%)
(0.2)
(29%)
Actuals
2019A
12.2
115%
29
27%
419
68%
1.0
148%
(1.2)
(10%)
(1.6)
(13%)
(2.3)
(19%)
2.9
396%
0.2
698%
8%
(0.7)
(25%)
(0.8)
(28%)
2020A
12.5
2%
25
(16%)
511
22%
1.6
54%
0.1
1%
(0.2)
(2%)
(0.8)
(7%)
5.5
86%
0.8
228%
14%
(0.0)
(1%)
(0.2)
(3%)
2021E
16.7
34%
29
20%
571
12%
2.3
46%
0.5
3%
0.2
1%
(0.6)
(3%)
7.5
38%
1.2
46%
15%
0.1
2%
0.1
1%
Projections
2022E
24.7
48%
36
23%
684
20%
3.3
40%
1.0
4%
0.6
3%
(0.2)
(1%)
10.6
42%
1.6
39%
15%
0.3
3%
0.2
2%
2023E
34.2
39%
43
19%
799
17%
4.5
39%
1.7
5%
1.3
4%
0.5
1%
14.7
38%
2.2
38%
15%
0.5
4%
0.5
3%
Note: 1. Monthly Transaction Users ("MTUS") is defined as monthly number of unique users who transact via Grab's products, where transact means to have successfully paid for any of our products; 2. Adjusted Net Revenue is a non-IFRS financial
measure, which adjusts our net revenue by adding back excess incentives. Excess incentives occur when payments made to driver/ merchant partners exceed Grab's revenue received from such driver/merchant partners (excess incentives are
calculated on a monthly basis for each country and not on a driver-by-driver basis). Our net revenue on which our Adjusted Net Revenue is based is subject to an ongoing PCAOB audit. 3. Contribution Profit (Loss) is a non-IFRS financial measure,
defined as Adjusted Net Revenue less direct costs (adjusted net revenue less subsidies, financial serviother direct costs) and sales and marketing expense (marketing costs and acquisition costs). We use Contribution Profit (Loss) to evaluate our
operating performance and trends. We believe that Contribution Profit (Loss) is a useful indicator of our profitability; 4. Regional costs comprises staff ces costs, rewards costs and costs (Grab engineering teams, corporate finance team, C-suite etc.),
subscription costs (such as cloud services, SMS costs, software subscription, mapping costs etc.), and other operating costs that are not allocatable to a segment. 5. Take rate for segment is calculated as Adjusted Net Revenue / GMV.
57View entire presentation