Kin SPAC Presentation Deck
kin.com | 21
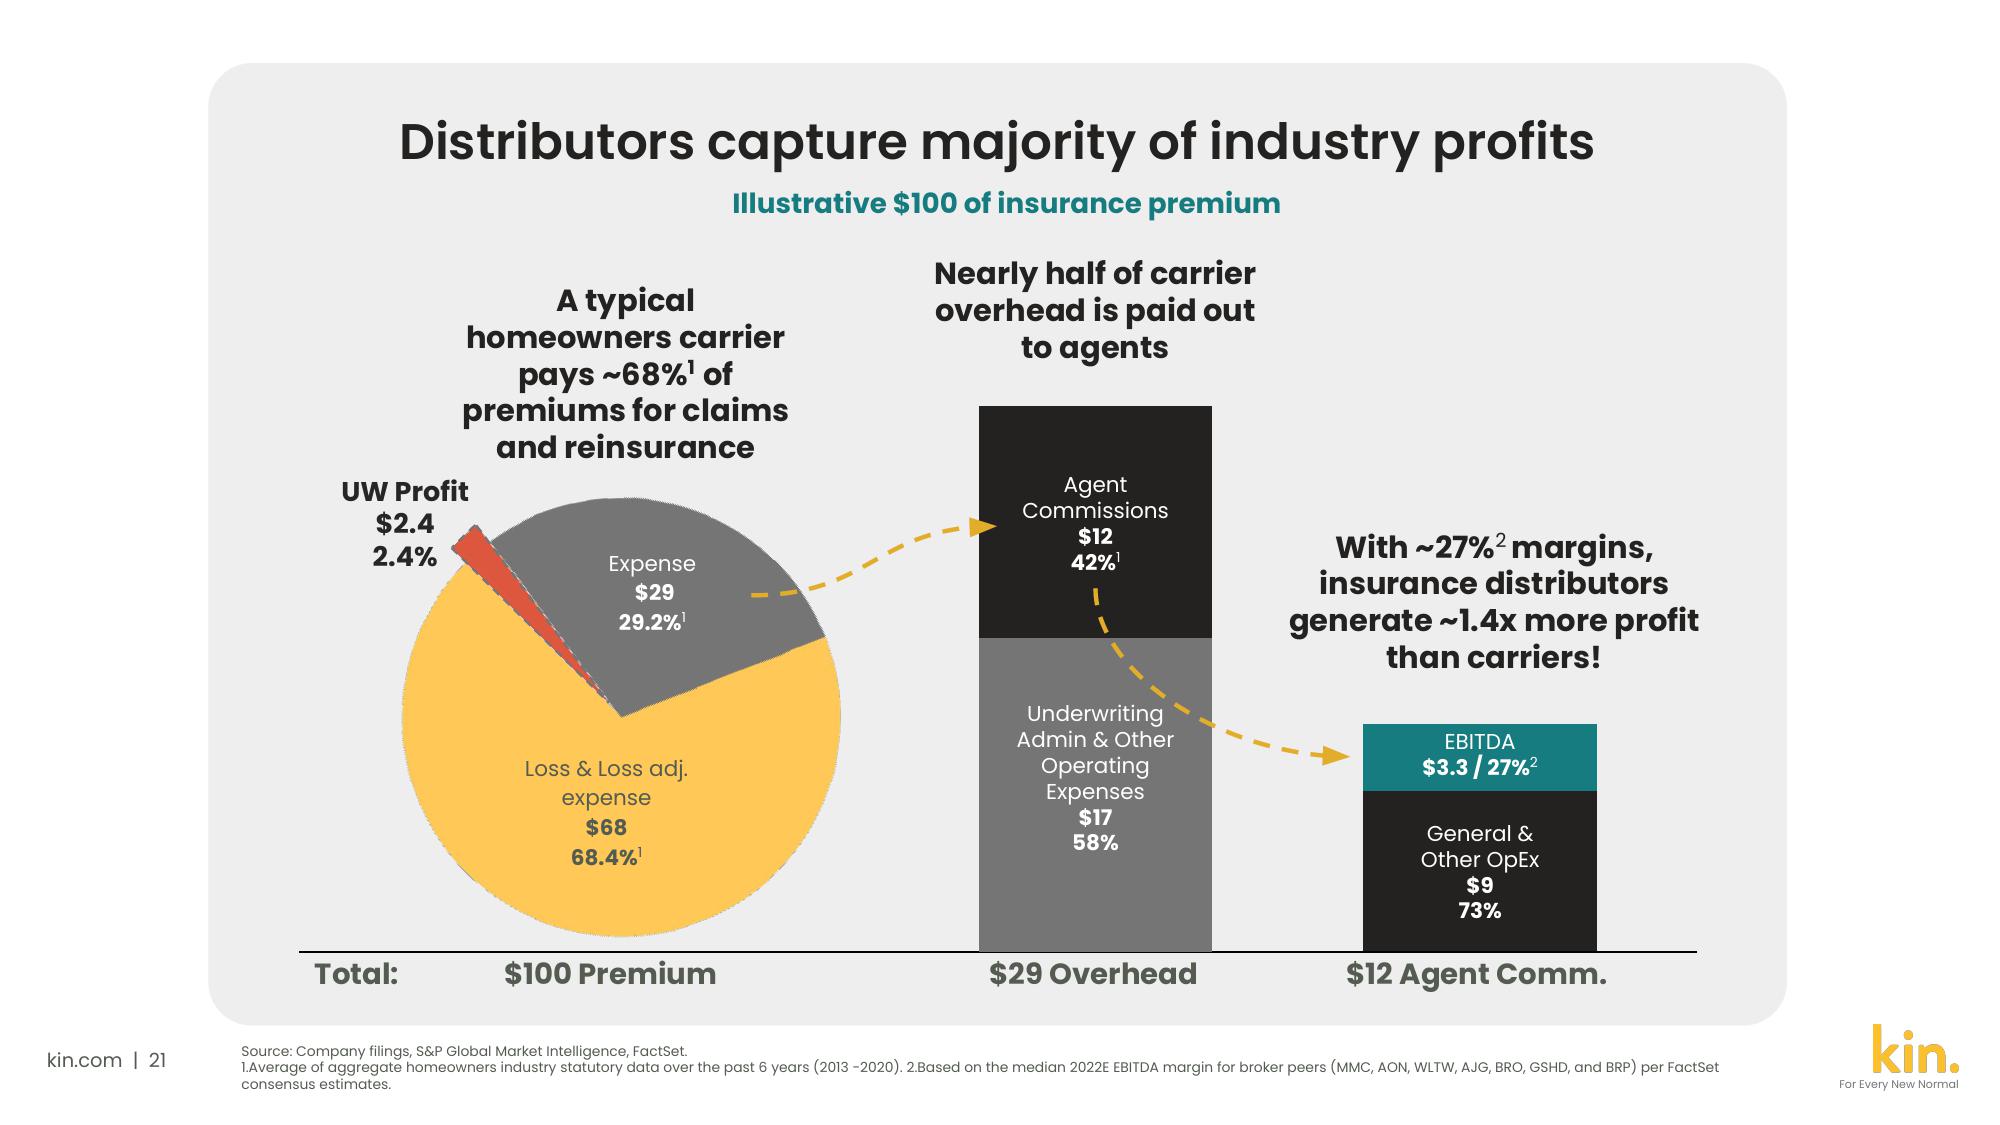
Distributors capture majority of industry profits
Illustrative $100 of insurance premium
A typical
homeowners carrier
pays ~68%' of
premiums for claims
and reinsurance
UW Profit
$2.4
2.4%
Total:
Expense
$29
29.2%¹
Loss & Loss adj.
expense
$68
68.4%¹
$100 Premium
Nearly half of carrier
overhead is paid out
to agents
Agent
Commissions
$12
42%¹
Underwriting
Admin & Other
Operating
Expenses
$17
58%
$29 Overhead
With ~27%² margins,
insurance distributors
generate ~1.4x more profit
than carriers!
EBITDA
$3.3/27%²
General &
Other OpEx
$9
73%
$12 Agent Comm.
Source: Company filings, S&P Global Market Intelligence, FactSet.
1.Average of aggregate homeowners industry statutory data over the past 6 years (2013-2020). 2.Based on the median 2022E EBITDA margin for broker peers (MMC, AON, WLTW, AJG, BRO, GSHD, and BRP) per FactSet
consensus estimates.
kin.
For Every New NormalView entire presentation