Inovalon Results Presentation Deck
Expanding Annual Revenue Coverage Visibility
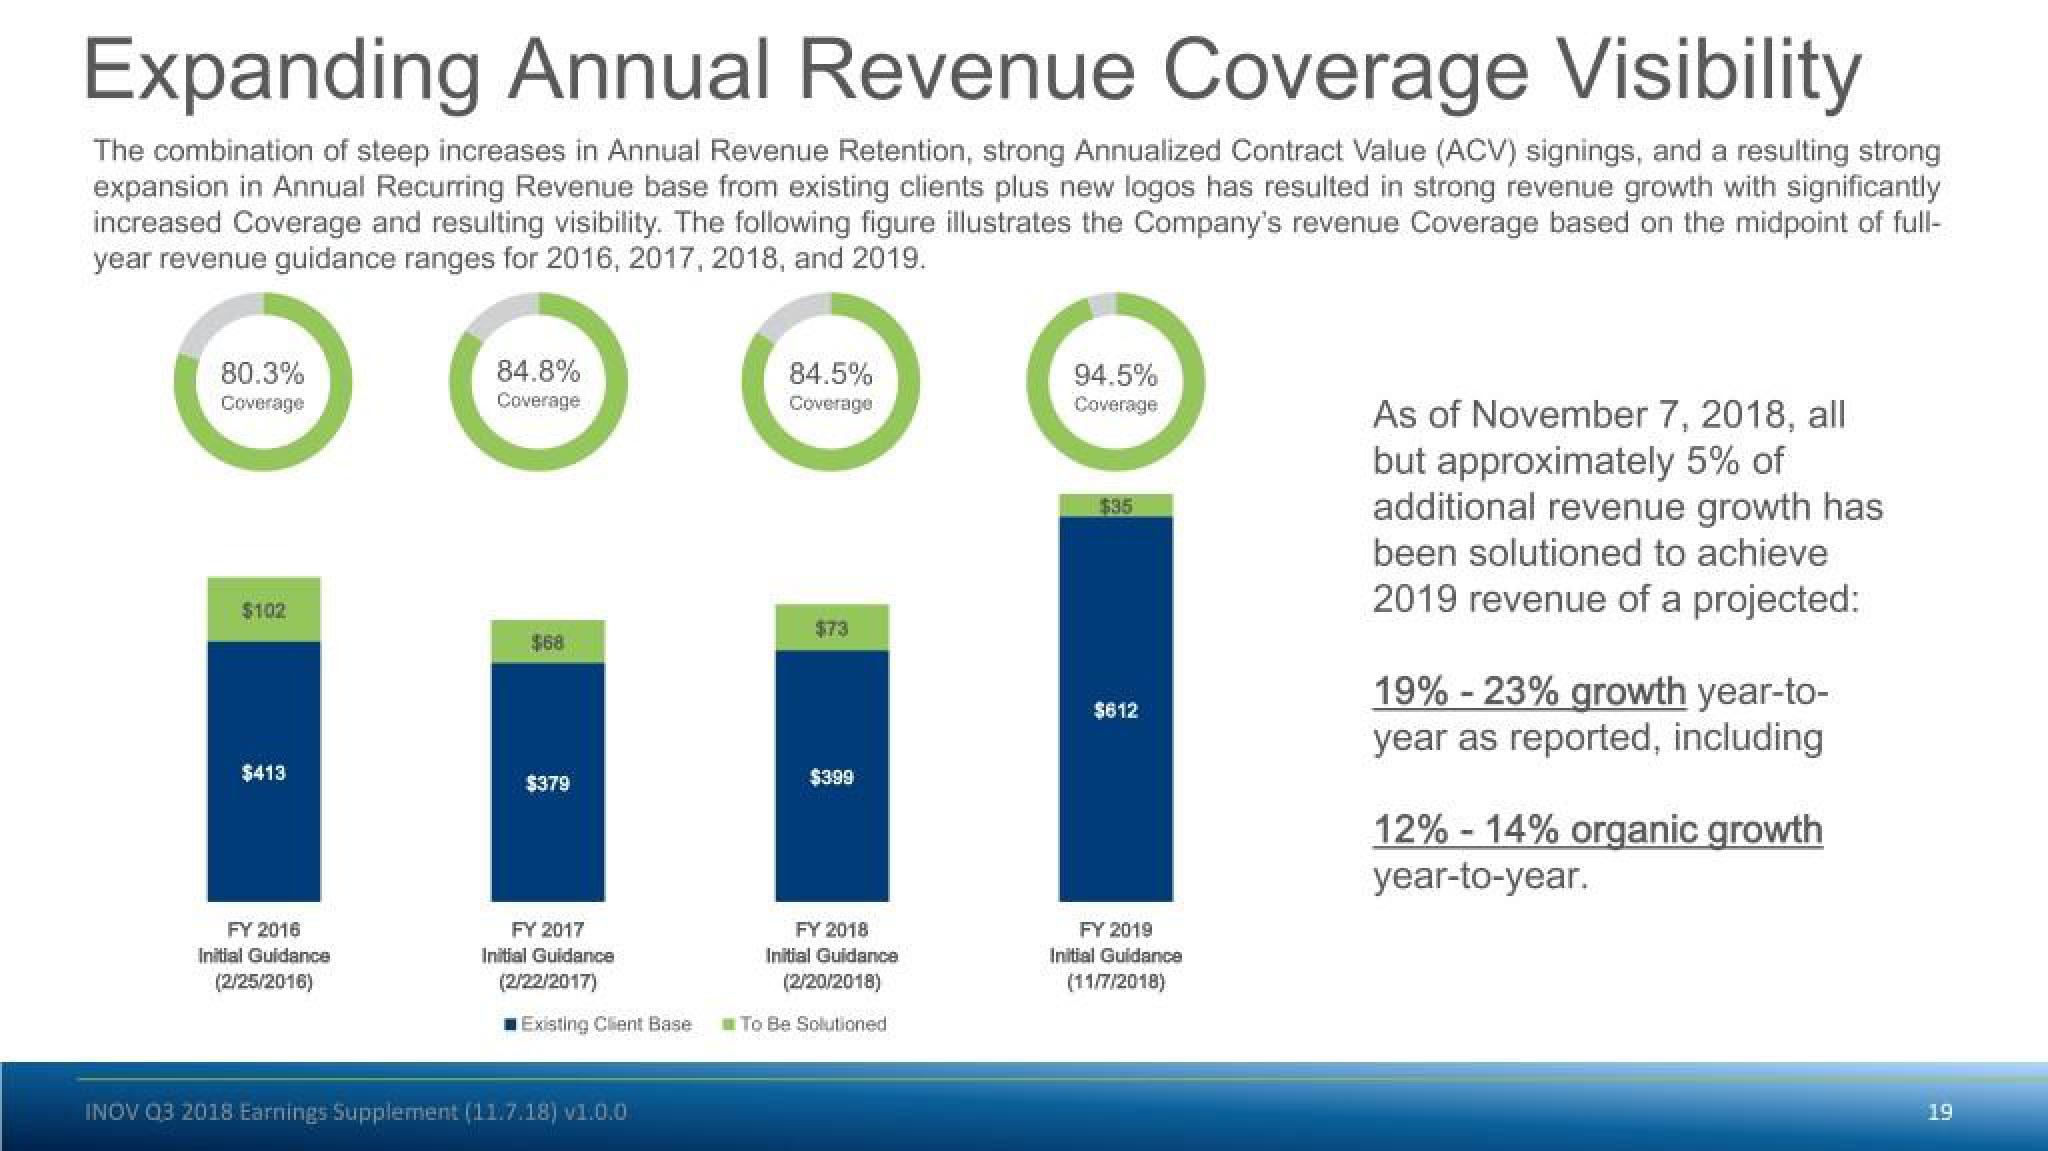
The combination of steep increases in Annual Revenue Retention, strong Annualized Contract Value (ACV) signings, and a resulting strong
expansion in Annual Recurring Revenue base from existing clients plus new logos has resulted in strong revenue growth with significantly
increased Coverage and resulting visibility. The following figure illustrates the Company's revenue Coverage based on the midpoint of full-
year revenue guidance ranges for 2016, 2017, 2018, and 2019.
80.3%
Coverage
$102
$413
FY 2016
Initial Guidance
(2/25/2016)
84.8%
Coverage
$68
$379
FY 2017
Initial Guidance
(2/22/2017)
Existing Client Base
INOV Q3 2018 Earnings Supplement (11.7.18) v1.0.0
84.5%
Coverage
$73
$399
FY 2018
Initial Guidance
(2/20/2018)
To Be Solutioned
94.5%
Coverage
$35
$612
FY 2019
Initial Guidance
(11/7/2018)
As of November 7, 2018, all
but approximately 5% of
additional revenue growth has
been solutioned to achieve
2019 revenue of a projected:
19% -23% growth year-to-
year as reported, including
12% -14% organic growth
year-to-year.
19View entire presentation