MoneyLion Results Presentation Deck
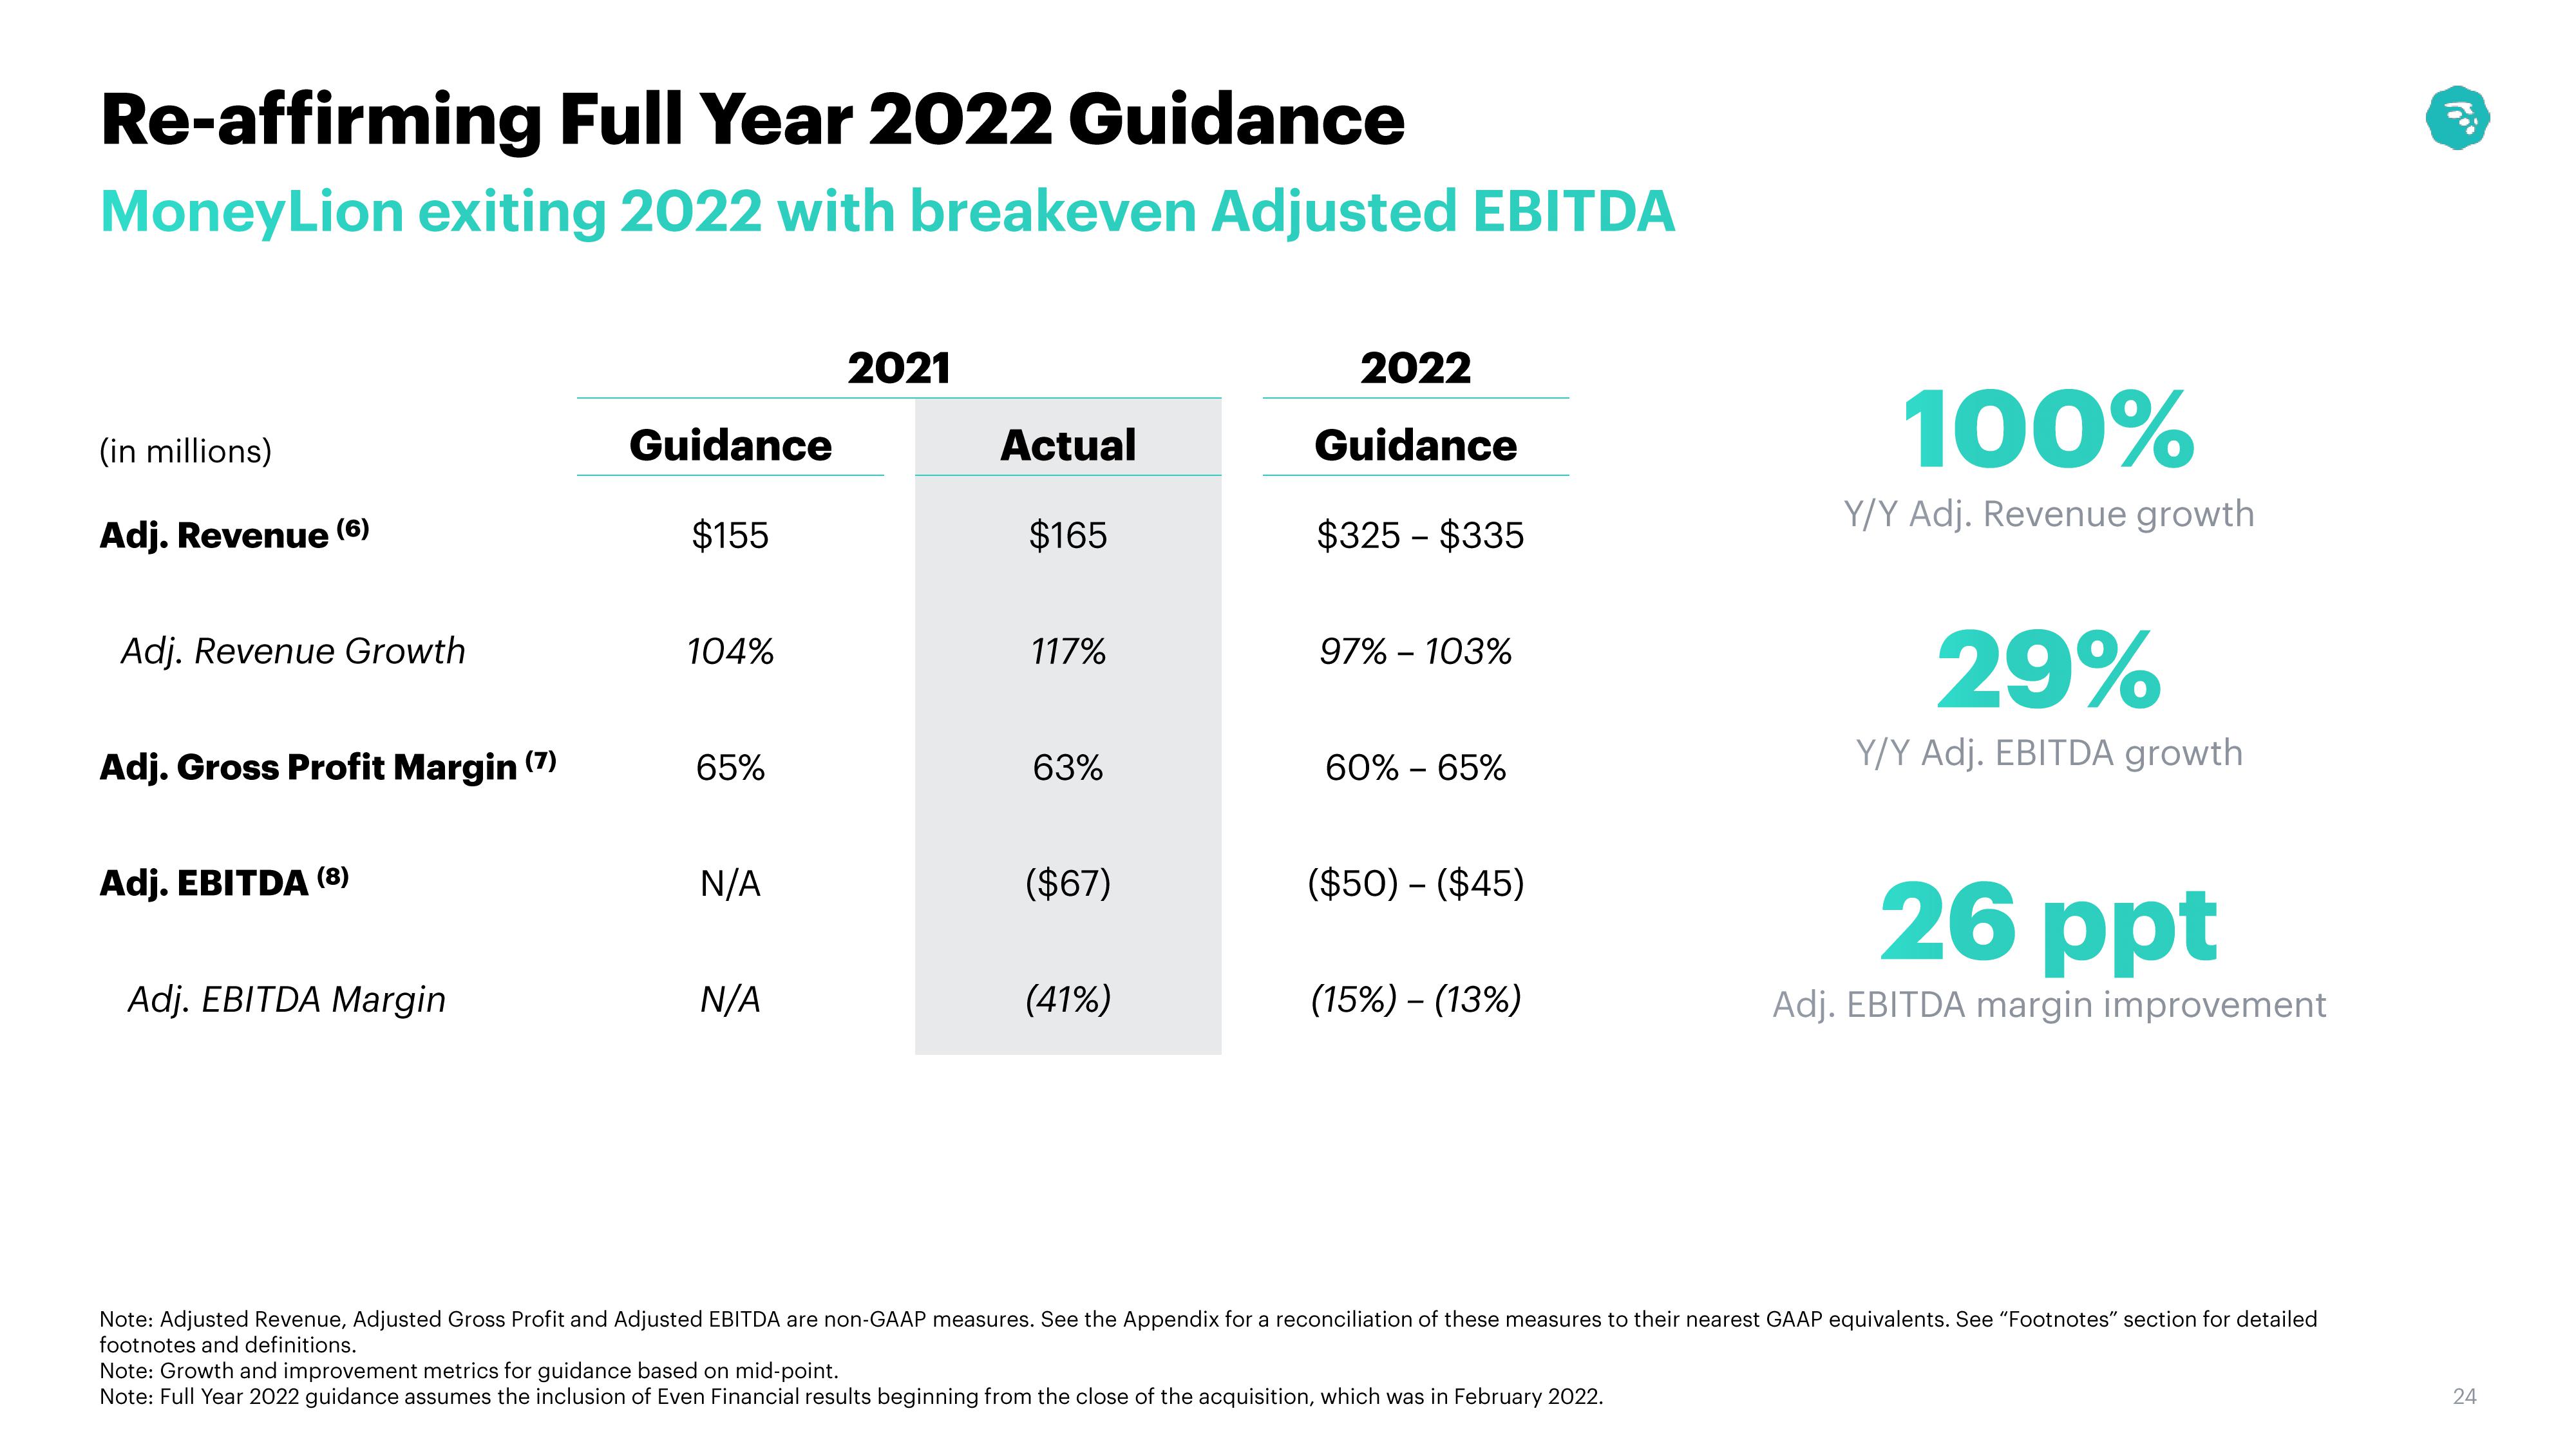
Re-affirming Full Year 2022 Guidance
MoneyLion exiting 2022 with breakeven Adjusted EBITDA
(in millions)
Adj. Revenue (6)
Adj. Revenue Growth
Adj. Gross Profit Margin (7)
Adj. EBITDA (8)
Adj. EBITDA Margin
Guidance
$155
104%
65%
N/A
N/A
2021
Actual
$165
117%
63%
($67)
(41%)
2022
Guidance
$325 - $335
97% - 103%
60% - 65%
($50) - ($45)
(15%) - (13%)
100%
Y/Y Adj. Revenue growth
Note: Growth and improvement metrics for guidance based on mid-point.
Note: Full Year 2022 guidance assumes the inclusion of Even Financial results beginning from the close of the acquisition, which was in February 2022.
29%
Y/Y Adj. EBITDA growth
26 ppt
Adj. EBITDA margin improvement
Note: Adjusted Revenue, Adjusted Gross Profit and Adjusted EBITDA are non-GAAP measures. See the Appendix for a reconciliation of these measures to their nearest GAAP equivalents. See "Footnotes" section for detailed
footnotes and definitions.
10⁰
24View entire presentation