Metals Company SPAC
BETTER METALS FOR EVS
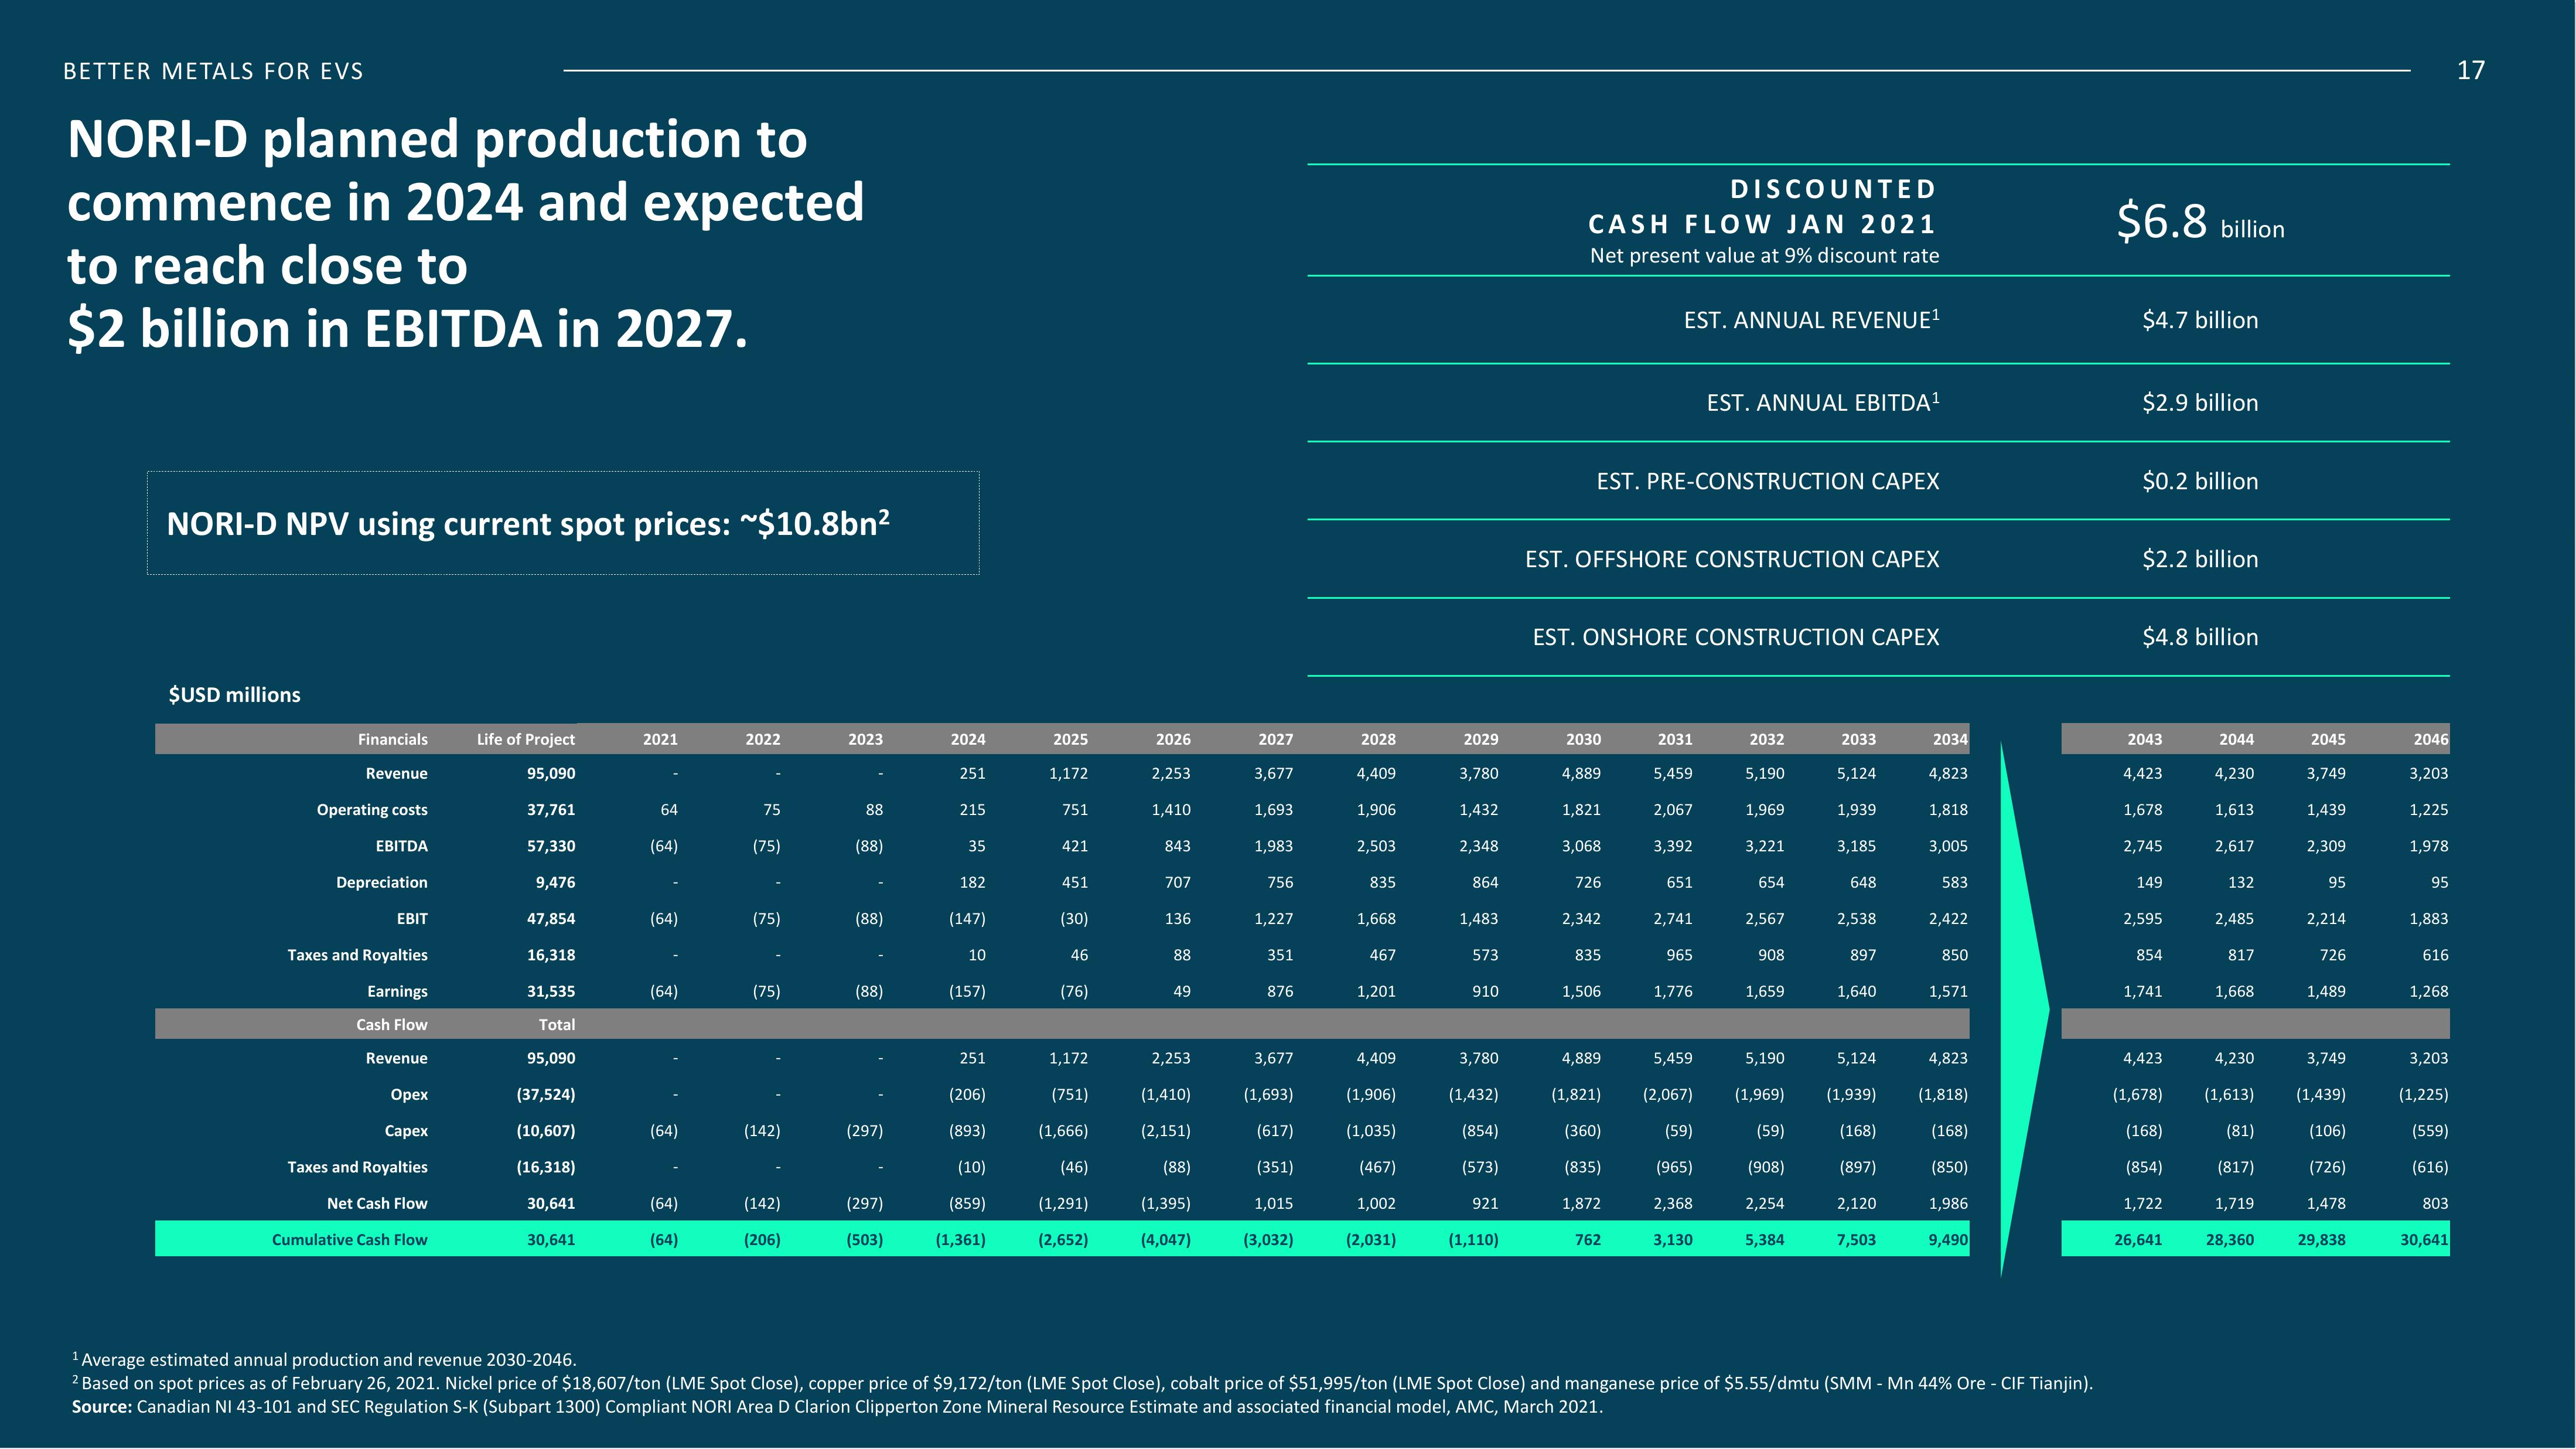
NORI-D planned production to
commence in 2024 and expected
to reach close to
$2 billion in EBITDA in 2027.
NORI-D NPV using current spot prices: ~$10.8bn²
$USD millions
Financials
Revenue
Operating costs
EBITDA
Depreciation
EBIT
Taxes and Royalties
Earnings
Cash Flow
Revenue
Opex
Capex
Taxes and Royalties
Net Cash Flow
Cumulative Cash Flow
Life of Project
95,090
37,761
57,330
9,476
47,854
16,318
31,535
Total
95,090
(37,524)
(10,607)
(16,318)
30,641
30,641
2021
64
(64)
(64)
(64)
(64)
(64)
(64)
2022
75
(75)
(75)
(75)
(142)
(142)
(206)
2023
88
(88)
(88)
(88)
(297)
(297)
(503)
2024
251
215
35
182
(147)
10
(157)
251
(206)
(893)
(10)
(859)
(1,361)
2025
1,172
751
421
451
(30)
46
(76)
1,172
(751)
(1,666)
(46)
(1,291)
(2,652)
2026
2,253
1,410
843
707
136
88
49
2,253
(1,410)
(2,151)
(88)
(1,395)
(4,047)
2027
3,677
1,693
1,983
756
1,227
351
876
3,677
(1,693)
(617)
(351)
1,015
(3,032)
2028
4,409
1,906
2,503
835
1,668
467
1,201
4,409
(1,906)
(1,035)
(467)
1,002
(2,031)
2029
3,780
1,432
2,348
864
1,483
573
910
3,780
(1,432)
(854)
(573)
921
(1,110)
DISCOUNTED
CASH FLOW JAN 2021
Net present value at 9% discount rate
EST. ANNUAL REVENUE¹
EST. PRE-CONSTRUCTION CAPEX
EST. OFFSHORE CONSTRUCTION CAPEX
2030
4,889
1,821
3,068
726
2,342
835
1,506
EST. ONSHORE CONSTRUCTION CAPEX
762
2031
5,459
2,067
3,392
651
EST. ANNUAL EBITDA¹
2,741
965
1,776
2032
5,190
1,969
3,221
654
2,567
908
1,659
4,889
5,190
5,459
(1,821) (2,067) (1,969)
(360)
(59)
(965)
(59)
(908)
(835)
1,872
2,368
2,254
3,130
5,384
2033
5,124
1,939
3,185
648
2,538
897
1,640
5,124
(1,939)
(168)
(897)
2,120
7,503
2034
4,823
1,818
3,005
583
2,422
850
1,571
4,823
(1,818)
(168)
(850)
1,986
9,490
¹ Average estimated annual production and revenue 2030-2046.
2 Based on spot prices as of February 26, 2021. Nickel price of $18,607/ton (LME Spot Close), copper price of $9,172/ton (LME Spot Close), cobalt price of $51,995/ton (LME Spot Close) and manganese price of $5.55/dmtu (SMM - Mn 44% Ore - CIF Tianjin).
Source: Canadian NI 43-101 and SEC Regulation S-K (Subpart 1300) Compliant NORI Area D Clarion Clipperton Zone Mineral Resource Estimate and associated financial model, AMC, March 2021.
$6.8 billion
$4.7 billion
$2.9 billion
$0.2 billion
$2.2 billion
$4.8 billion
2043
4,423
1,678
2,745
149
2,595
854
1,741
4,423
(1,678)
(168)
(854)
1,722
26,641
2044
4,230
1,613
2,617
132
2,485
817
1,668
4,230
(1,613)
(81)
(817)
1,719
28,360
2045
3,749
1,439
2,309
95
2,214
726
1,489
3,749
(1,439)
(106)
(726)
1,478
29,838
2046
3,203
1,225
1,978
95
1,883
616
1,268
3,203
(1,225)
(559)
(616)
803
30,641
17View entire presentation