Forge SPAC Presentation Deck
Counterparty Trends
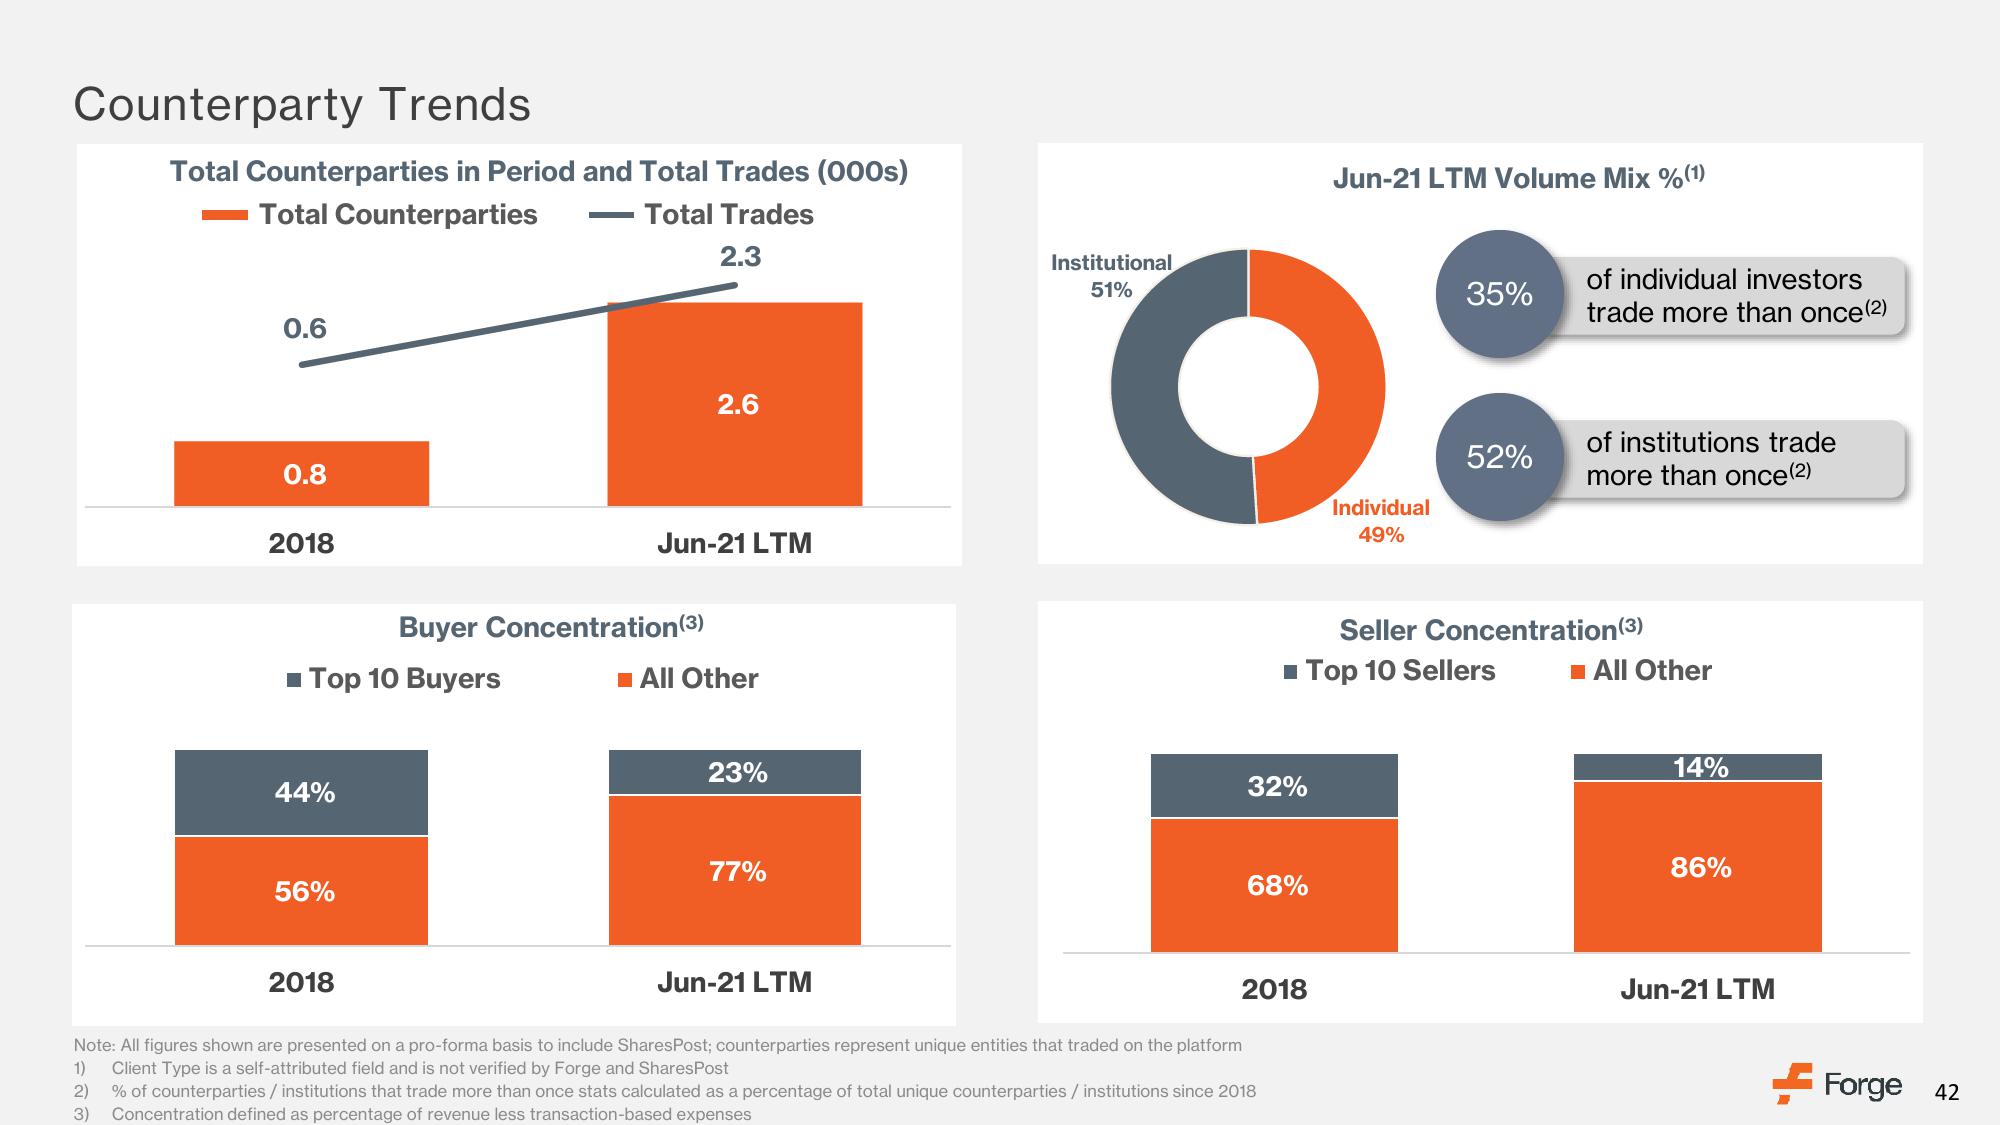
Total Counterparties in Period and Total Trades (000s)
- Total Counterparties
- Total Trades
2.3
0.6
0.8
2018
■ Top 10 Buyers
44%
56%
2018
Buyer Concentration (3)
2.6
Jun-21 LTM
■All Other
23%
77%
Jun-21 LTM
Institutional
51%
32%
68%
2018
Note: All figures shown are presented on a pro-forma basis to include SharesPost; counterparties represent unique entities that traded on the platform
1) Client Type is a self-attributed field and is not verified by Forge and SharesPost
2)
% of counterparties / institutions that trade more than once stats calculated as a percentage of total unique counterparties / institutions since 2018
Concentration defined as percentage of revenue less transaction-based expenses
3)
Jun-21 LTM Volume Mix %(1)
Individual
49%
35%
■ Top 10 Sellers
52%
of individual investors
trade more than once(2)
of institutions trade
more than once(2)
Seller Concentration (3)
■All Other
14%
86%
Jun-21 LTM
Forge 42View entire presentation