HireRight Results Presentation Deck
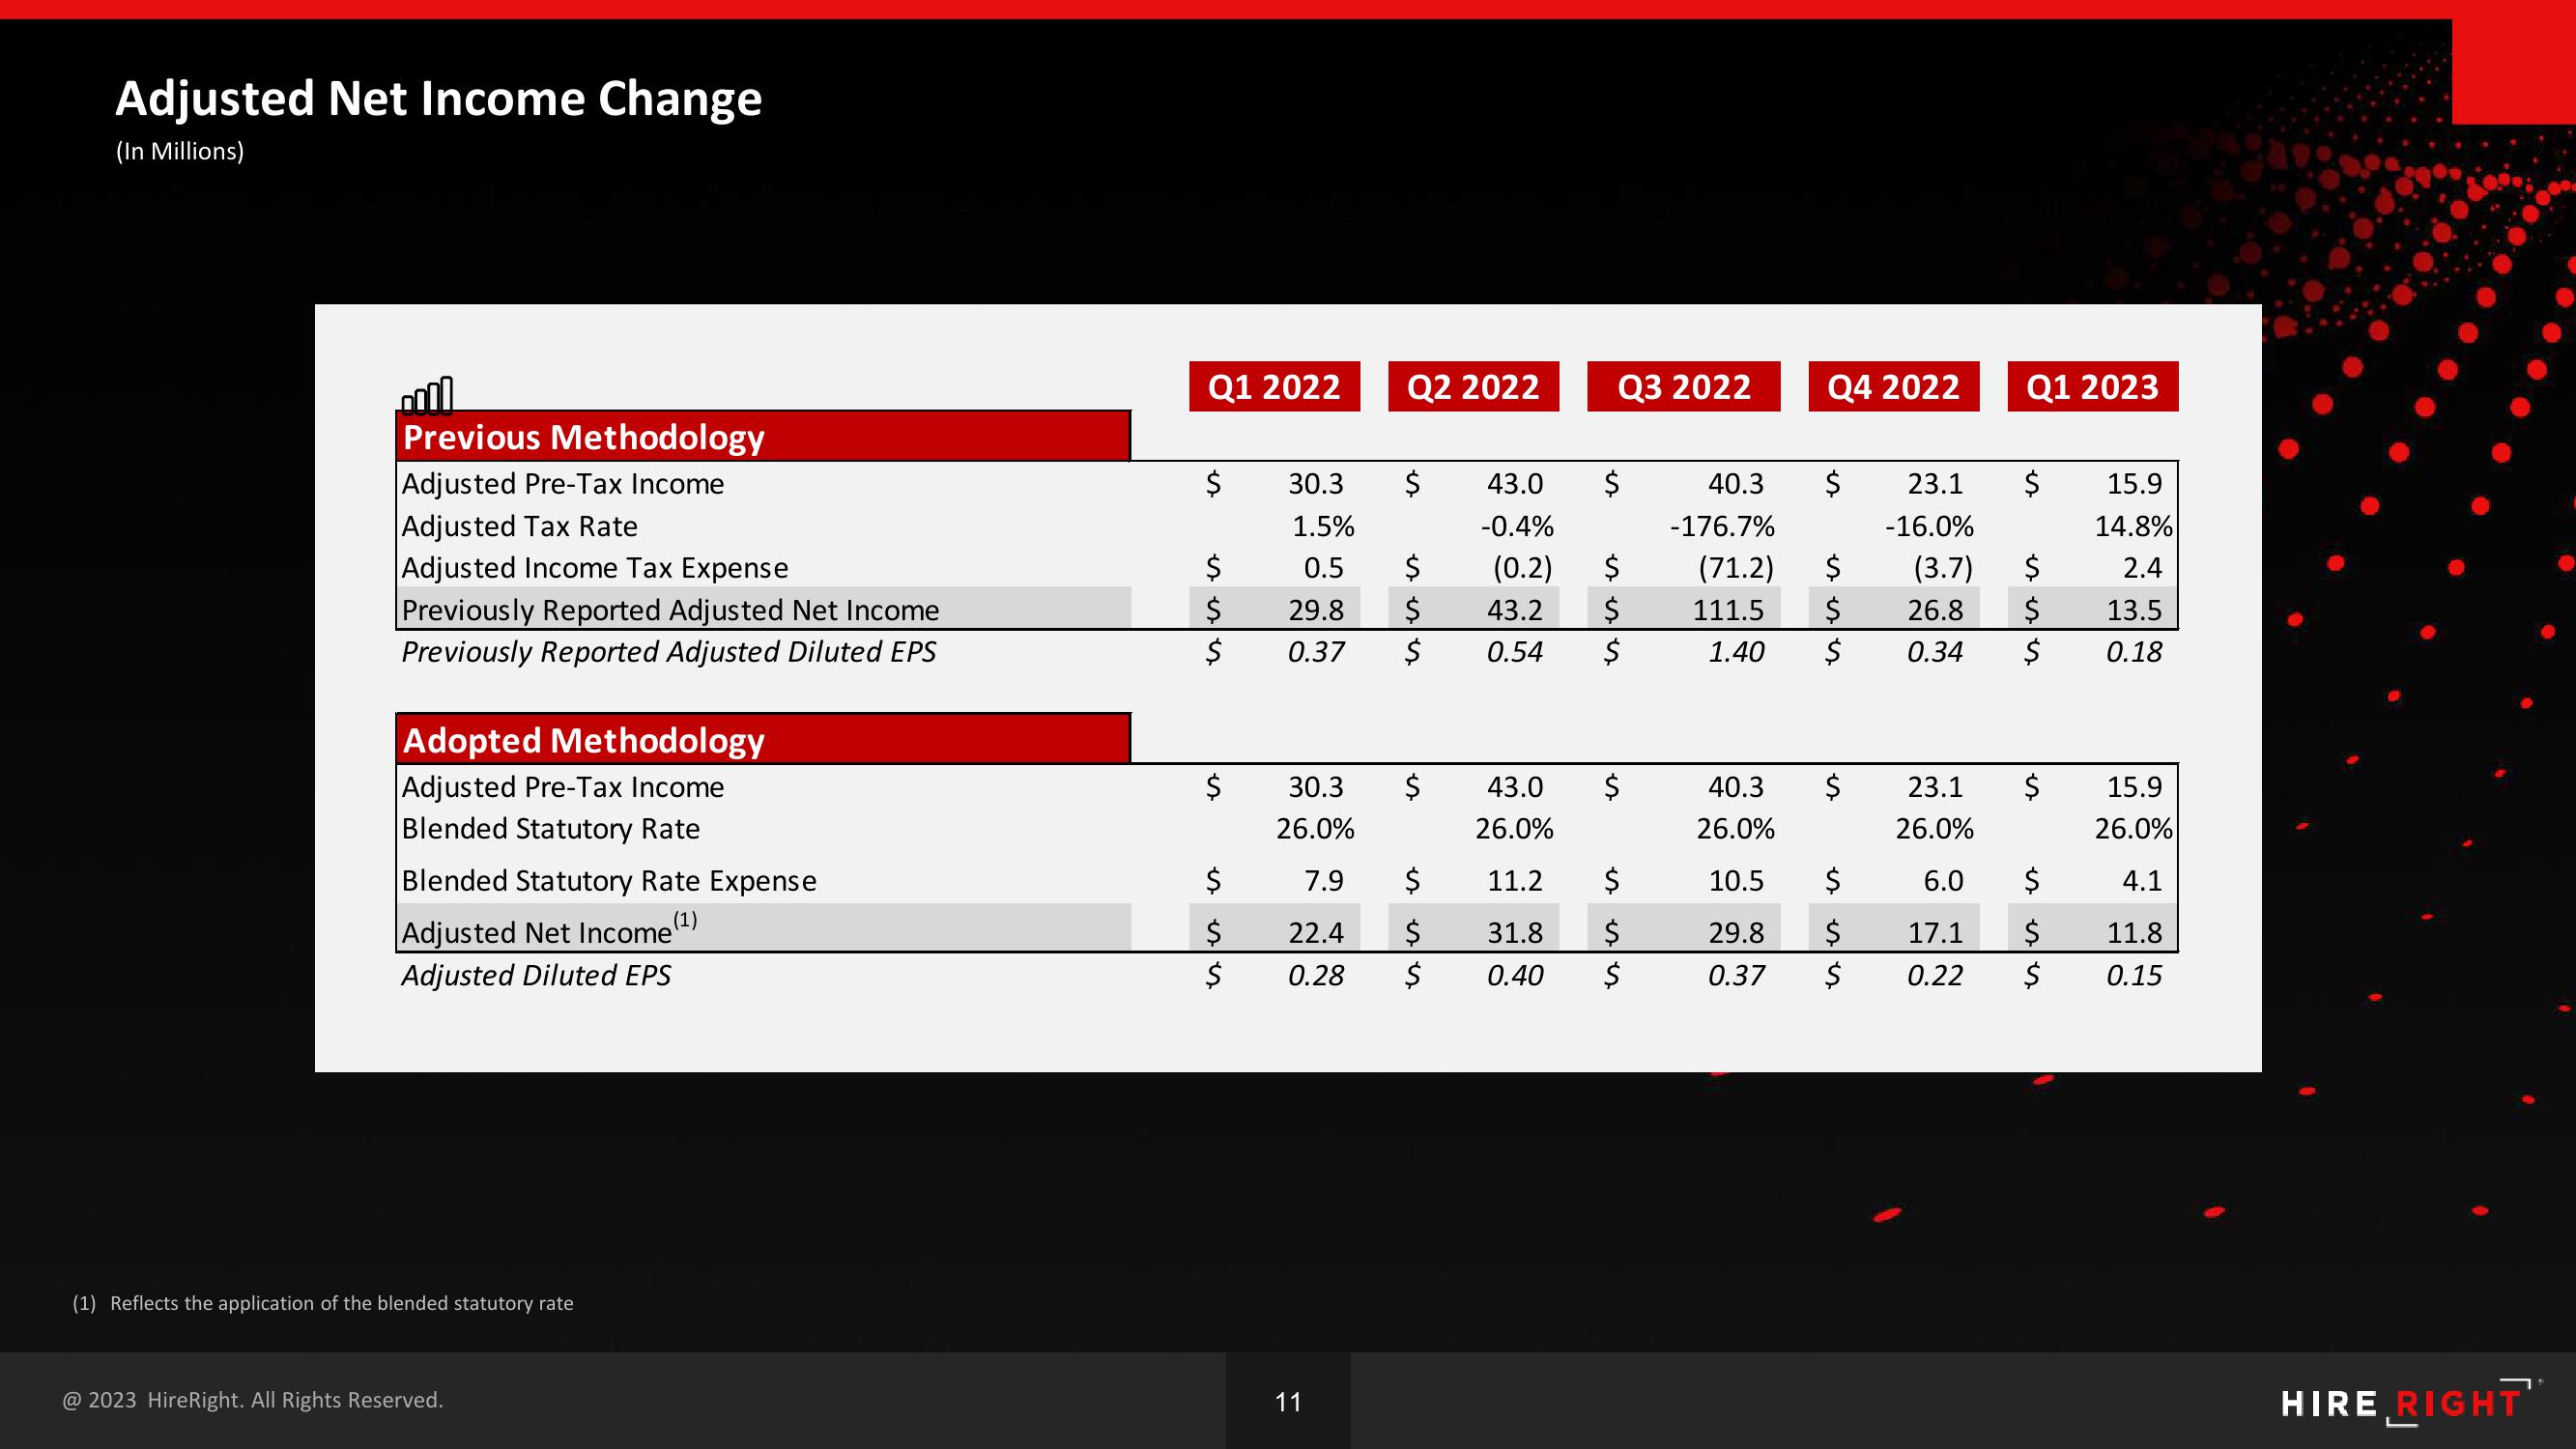
Adjusted Net Income Change
(In Millions)
0
Previous Methodology
Adjusted Pre-Tax Income
Adjusted Tax Rate
Adjusted Income Tax Expense
Previously Reported Adjusted Net Income
Previously Reported Adjusted Diluted EPS
Adopted Methodology
Adjusted Pre-Tax Income
Blended Statutory Rate
Blended Statutory Rate Expense
(1)
Adjusted Net Income
Adjusted Diluted EPS
(1) Reflects the application of the blended statutory rate
@ 2023 HireRight. All Rights Reserved.
Q1 2022
$
$
$
$
$
30.3
1.5%
0.5
29.8
0.37
Q2 2022
$
11
$
$
$
30.3 $
26.0%
$
7.9
22.4
0.28 $
$
43.0
-0.4%
(0.2)
43.2
0.54
Q3 2022
$
$
43.0 $
26.0%
11.2
31.8
0.40
$
جة
$
Q4 2022
40.3
23.1
-176.7%
-16.0%
(71.2) $ (3.7)
111.5 $ 26.8 $
1.40 $ 0.34 $
40.3 $
26.0%
10.5
29.8
0.37
23.1
26.0%
Q1 2023
6.0
$ 17.1
$ 0.22
$
$
$
15.9
14.8%
2.4
13.5
0.18
15.9
26.0%
4.1
11.8
0.15
HIRE RIGHTView entire presentation