Deutsche Bank Fixed Income Presentation Deck
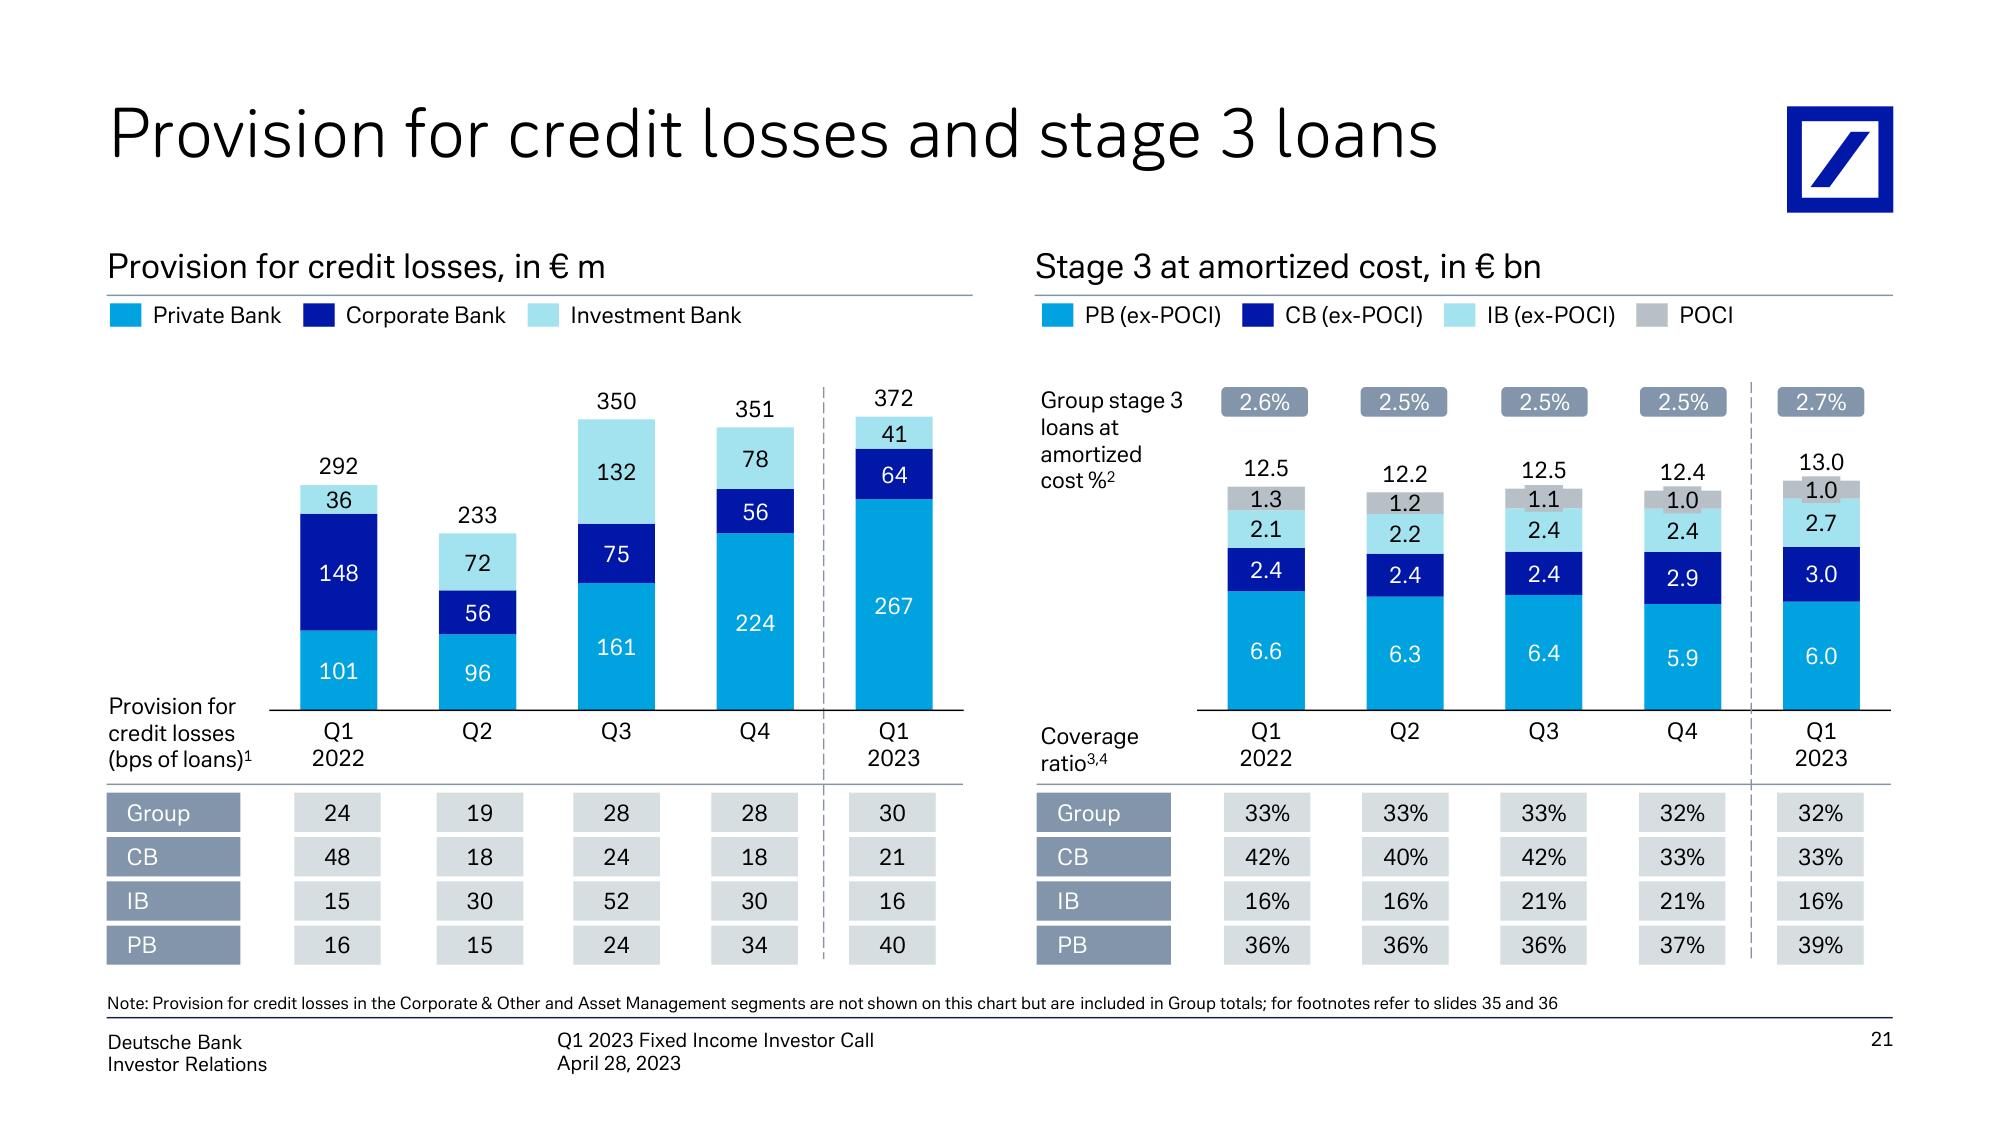
Provision for credit losses and stage 3 loans
Provision for credit losses, in € m
Private Bank
Corporate Bank
Provision for
credit losses
(bps of loans)¹
Group
CB
IB
PB
292
36
148
101
Q1
2022
24
48
15
16
233
72
56
96
Q2
19
18
30
15
Investment Bank
350
132
75
161
Q3
28
24
52
24
351
78
56
224
Q4
28
18
30
34
372
41
64
267
Q1
2023
30
21
16
40
Stage 3 at amortized cost, in € bn
PB (ex-POCI)
CB (ex-POCI)
Group stage 3
loans at
amortized
cost%²
Coverage
ratio 3,4
Group
CB
IB
PB
2.6%
12.5
1.3
2.1
2.4
6.6
Q1
2022
33%
42%
16%
36%
2.5%
12.2
1.2
2.2
2.4
6.3
Q2
33%
40%
16%
36%
IB (ex-POCI)
2.5%
12.5
1.1
2.4
2.4
6.4
Q3
33%
42%
21%
36%
Note: Provision for credit losses in the Corporate & Other and Asset Management segments are not shown on this chart but are included in Group totals; for footnotes refer to slides 35 and 36
Deutsche Bank
Q1 2023 Fixed Income Investor Call
Investor Relations
April 28, 2023
POCI
2.5%
12.4
1.0
2.4
2.9
5.9
Q4
32%
33%
21%
37%
/
2.7%
13.0
1.0
2.7
3.0
6.0
Q1
2023
32%
33%
16%
39%
21View entire presentation