HashiCorp Investor Day Presentation Deck
41
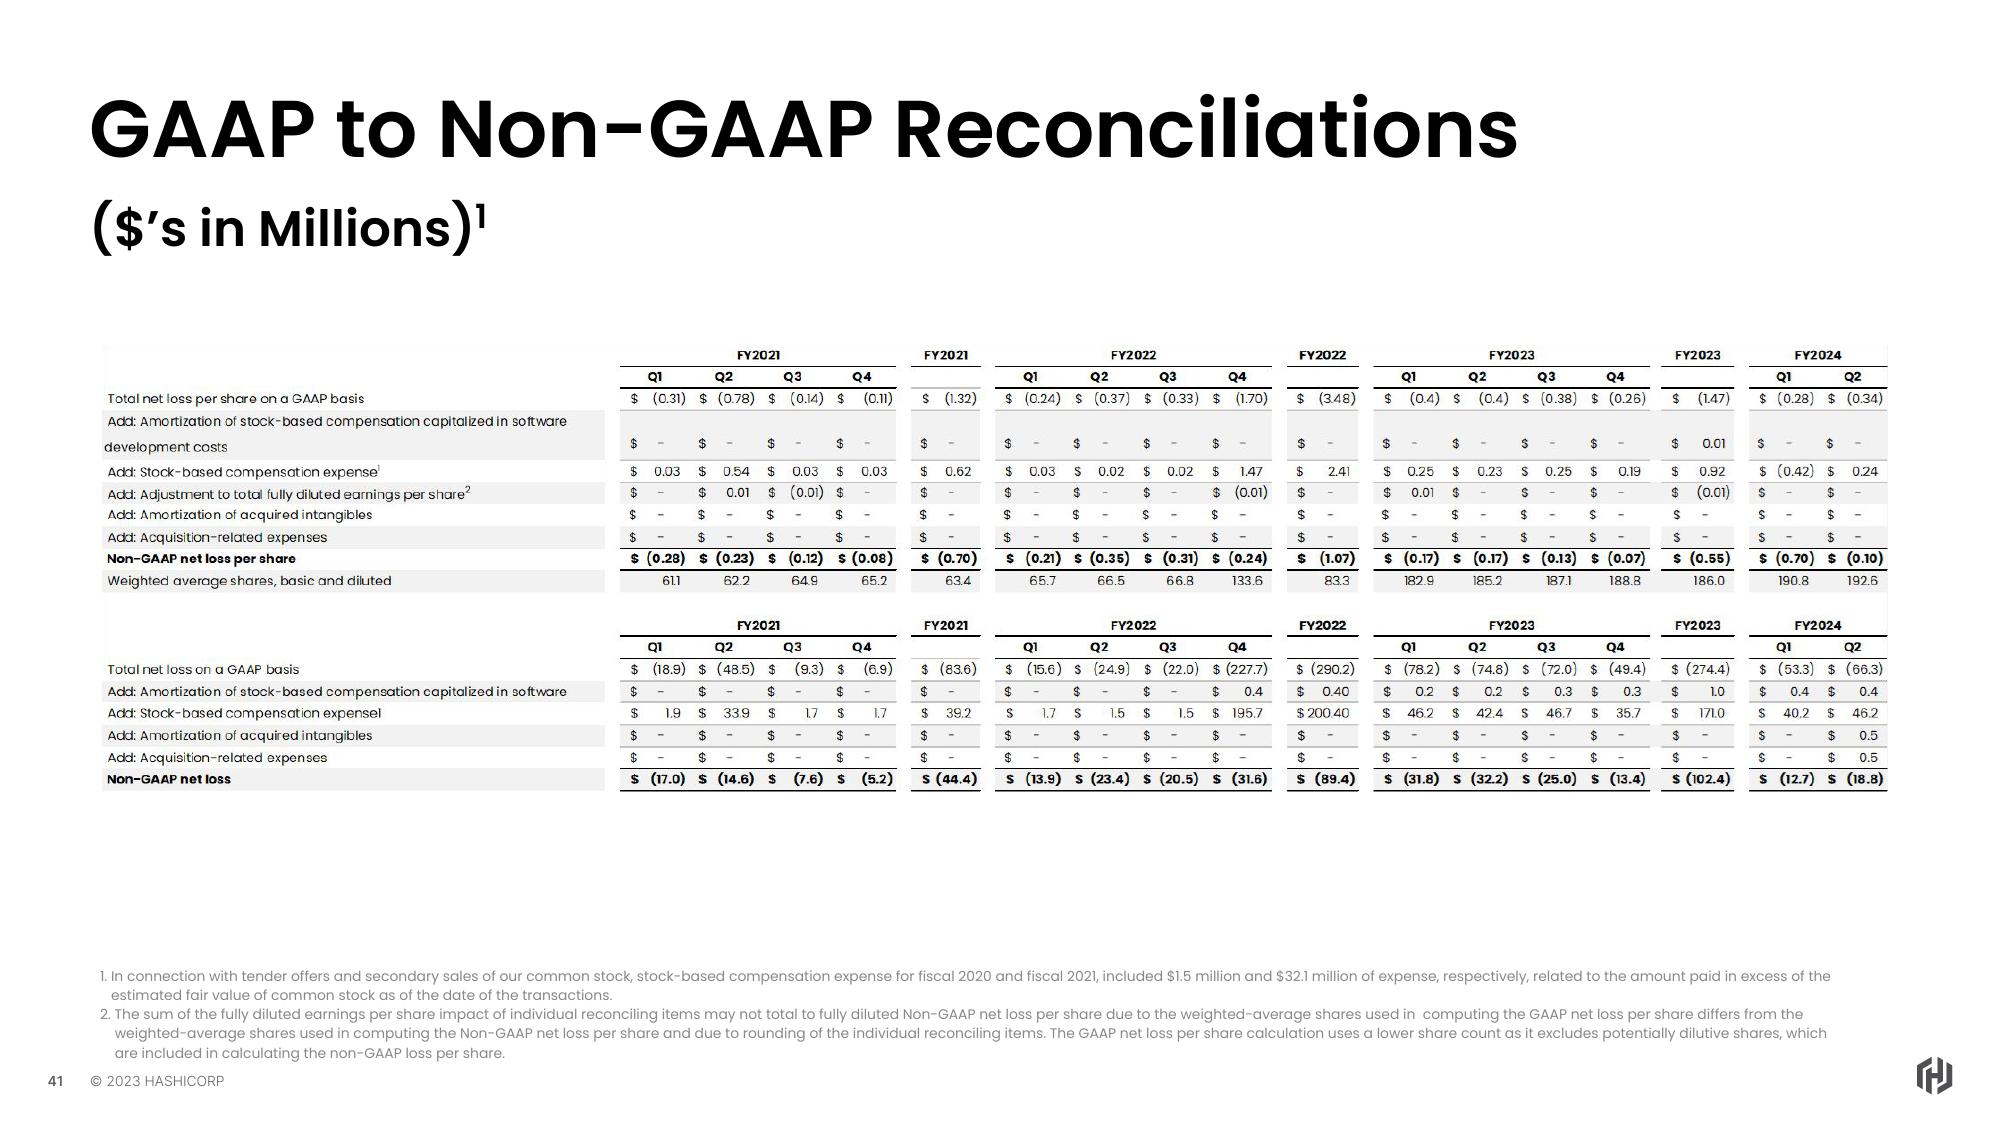
GAAP to Non-GAAP Reconciliations
($'s in Millions)¹
Total net loss per share on a GAAP basis
Add: Amortization of stock-based compensation capitalized in software
development costs
Add: Stock-based compensation expense
Add: Adjustment to total fully diluted earnings per share²
Add: Amortization of acquired intangibles
Add: Acquisition-related expenses
Non-GAAP net loss per sharo
Weighted average shares, basic and diluted
Total net loss on a GAAP basis
Add: Amortization of stock-based compensation capitalized in software
Add: Stock-based compensation expensel
Add: Amortization of acquired intangibles
Add: Acquisition-related expenses
Non-GAAP net loss
Q1
$ (0.31)
$
$
$
$ 0.03
$
$ (0.01) $
$
$ -
$
$
$
$
$ -
$ (0.28) $ (0.23) $ (0.12) $ (0.08)
611
62.2
649
65.2
$
$
0.03
Q2
Q3
Q4
$ (0.78) $ (0.14) $ (0.11)
-
$
$
$
FY2021
$
-
0.54
0.01
FY2021
Q1
Q2
$(18.9) $ (48.5) $
$
$
$
$
1.9 $ 33.9
$
$
$
$
$
S (17.0) S (14.6) S
-
Q3
Q4
(9.3) $
$
$
$ -
17
-
0.03
$
(6.9)
$
$
(7.6) S (5.2)
1,7
FY2021
$ (1.32)
$
$ 0.62
$
$
$
$ (0.70)
63.4
FY2021
Q1
Q2
Q3
Q4
$ (0.24) $ (0.37) $ (0.33) $ (1.70)
$
$ 0.03
$
$
$
$ 1.47
$ (0.01)
$
$
$
$
$
-
$
$
s (0.21) S (0.35) $ (0.31) $ (0.24)
65.7
66.5
66.8
133.6
$
-
FY2022
$
S
$
1.7
-
0.02
$
Q1
Q2
Q3
Q4
$ (83.6)
$ (15.6) S (24.9) $ (22.0) $ (227.7)
$
$
$
$
$ 0.4
$195.7
$ 39.2
S
$
$
$
$
$
$
$
$
$
$
$
s (44.4) Is (13.9) S (23.4) $ (20.5) $ (31.6)
$ 0.02
$
FY2022
1.5
1.5
-
-
FY2022
$ (348)
$
$
$
$
$
$ (1.07)
83.3
2.41
-
FY2022
$ (290.2)
$ 0.40
$ 200,40
$
$
$ (89.4)
Q1
Q2
Q3
Q4
$ (0.4) S (0.4) S (0.38) $ (0.26)
$
$ 0.25
$
$ 0.01 $
$
$
$
$
$ 0.19
$
$
S
$ -
$ - $
$
$ (0.17) $ (0.17) $ (0.13) $ (0.07)
182.9
185.2
187.1
188.8
FY2023
-
$
0.23 S
FY2023
0.25
-
Q4
Q1
Q2
Q3
$ (782) $ (74.8) $ (72.0) $ (49.4)
$ 0.2 $ 0.2 $ 0.3 $ 0.3
$ 46.2 $ 42.4 S 46.7 $ 35.7
$
$
$
$
$
$
$
$
$ (31.8) S (32.2) S (25.0) $ (13.4)
FY2023
$ (1.47)
$
0.01
$ 0.92
$ (0.01)
$
$
$ (0.55)
186.0
FY2023
$ (274.4)
$
1.0
$ 171.0
$
$
$ (102.4)
FY2024
Q1
Q2
$ (0.28) $ (0.34)
$
$
$ (0.42) $ 0.24
$
$
$
$
$
$
$ (0.70) $ (0.10)
190.8
192.6
-
FY2024
Q1
Q2
$ (53.3) $ (66.3)
$ 0.4 $ 0.4
$ 40.2 $ 46.2
$ 0.5
$
$
$ 0.5
s (12.7) S (18.8)
1. In connection with tender offers and secondary sales of our common stock, stock-based compensation expense for fiscal 2020 and fiscal 2021, included $1.5 million and $32.1 million of expense, respectively, related to the amount paid in excess of the
estimated fair value of common stock as of the date of the transactions.
2. The sum of the fully diluted earnings per share impact of individual reconciling items may not total to fully diluted Non-GAAP net loss per share due to the weighted-average shares used in computing the GAAP net loss per share differs from the
weighted-average shares used in computing the Non-GAAP net loss per share and due to rounding of the individual reconciling items. The GAAP net loss per share calculation uses a lower share count as it excludes potentially dilutive shares, which
are included in calculating the non-GAAP loss per share.
© 2023 HASHICORPView entire presentation