Bed Bath & Beyond Results Presentation Deck
Non-GAAP
Reconciliation*
(in thousands, except per share
data)
(unaudited)
14
Reconciliation of Adjusted Effective Income Tax Rate
Reported effective income tax rate
Impact on operating loss and benefit for income taxes of goodwill and other
impairments, severance costs, and loss from sale-leaseback transaction,
including transaction fees
Adjusted effective income tax rate
Reconciliation of Adjusted Net (Loss) Earnings
Reported net (loss) earnings
Pre-tax adjustments:
Incremental charge for markdowns
Severance costs
Goodwill and other impairments (a)
Shareholder activity costs
Loss from sale-leaseback
Gain on sale of a building
Total pre-tax adjustments
Tax impact of adjustments
transaction, including transaction fees
Total adjustments, after tax
Adjusted net (loss) earnings
Reconciliation of Adjusted Net (Loss) Earnings per Diluted Share
Reported net (loss) earnings per diluted share
Goodwill and other impairments, severance costs, shareholder activity costs,
incremental charge for markdowns, loss on sale leaseback
transaction, including transaction fees, and gain on sale of a building
Adjusted net (loss) earnings per diluted share
February 29,
2020
$
$
$
Three Months Ended
March 2,
2019
$
32.3%
(3.3%)
(65,414)
41,308
67,821
32,840
141,969
(29,666)
112,303
$
46,889 $
(0.53)
$
0.91
0.38 $
18.7%
19.7%
(253,793)
509,905
509,905
(97,286)
412,619
158,826
Twelve Months Ended
February 29,
March 2,
2019
2020
3.12
1.20
$
(1.92) $
$
(613,816) $
169,820
102,507
509,226
8,000
32,840
822,393
(151,231)
671,162
57,346
(4.94)
5.40
0.46
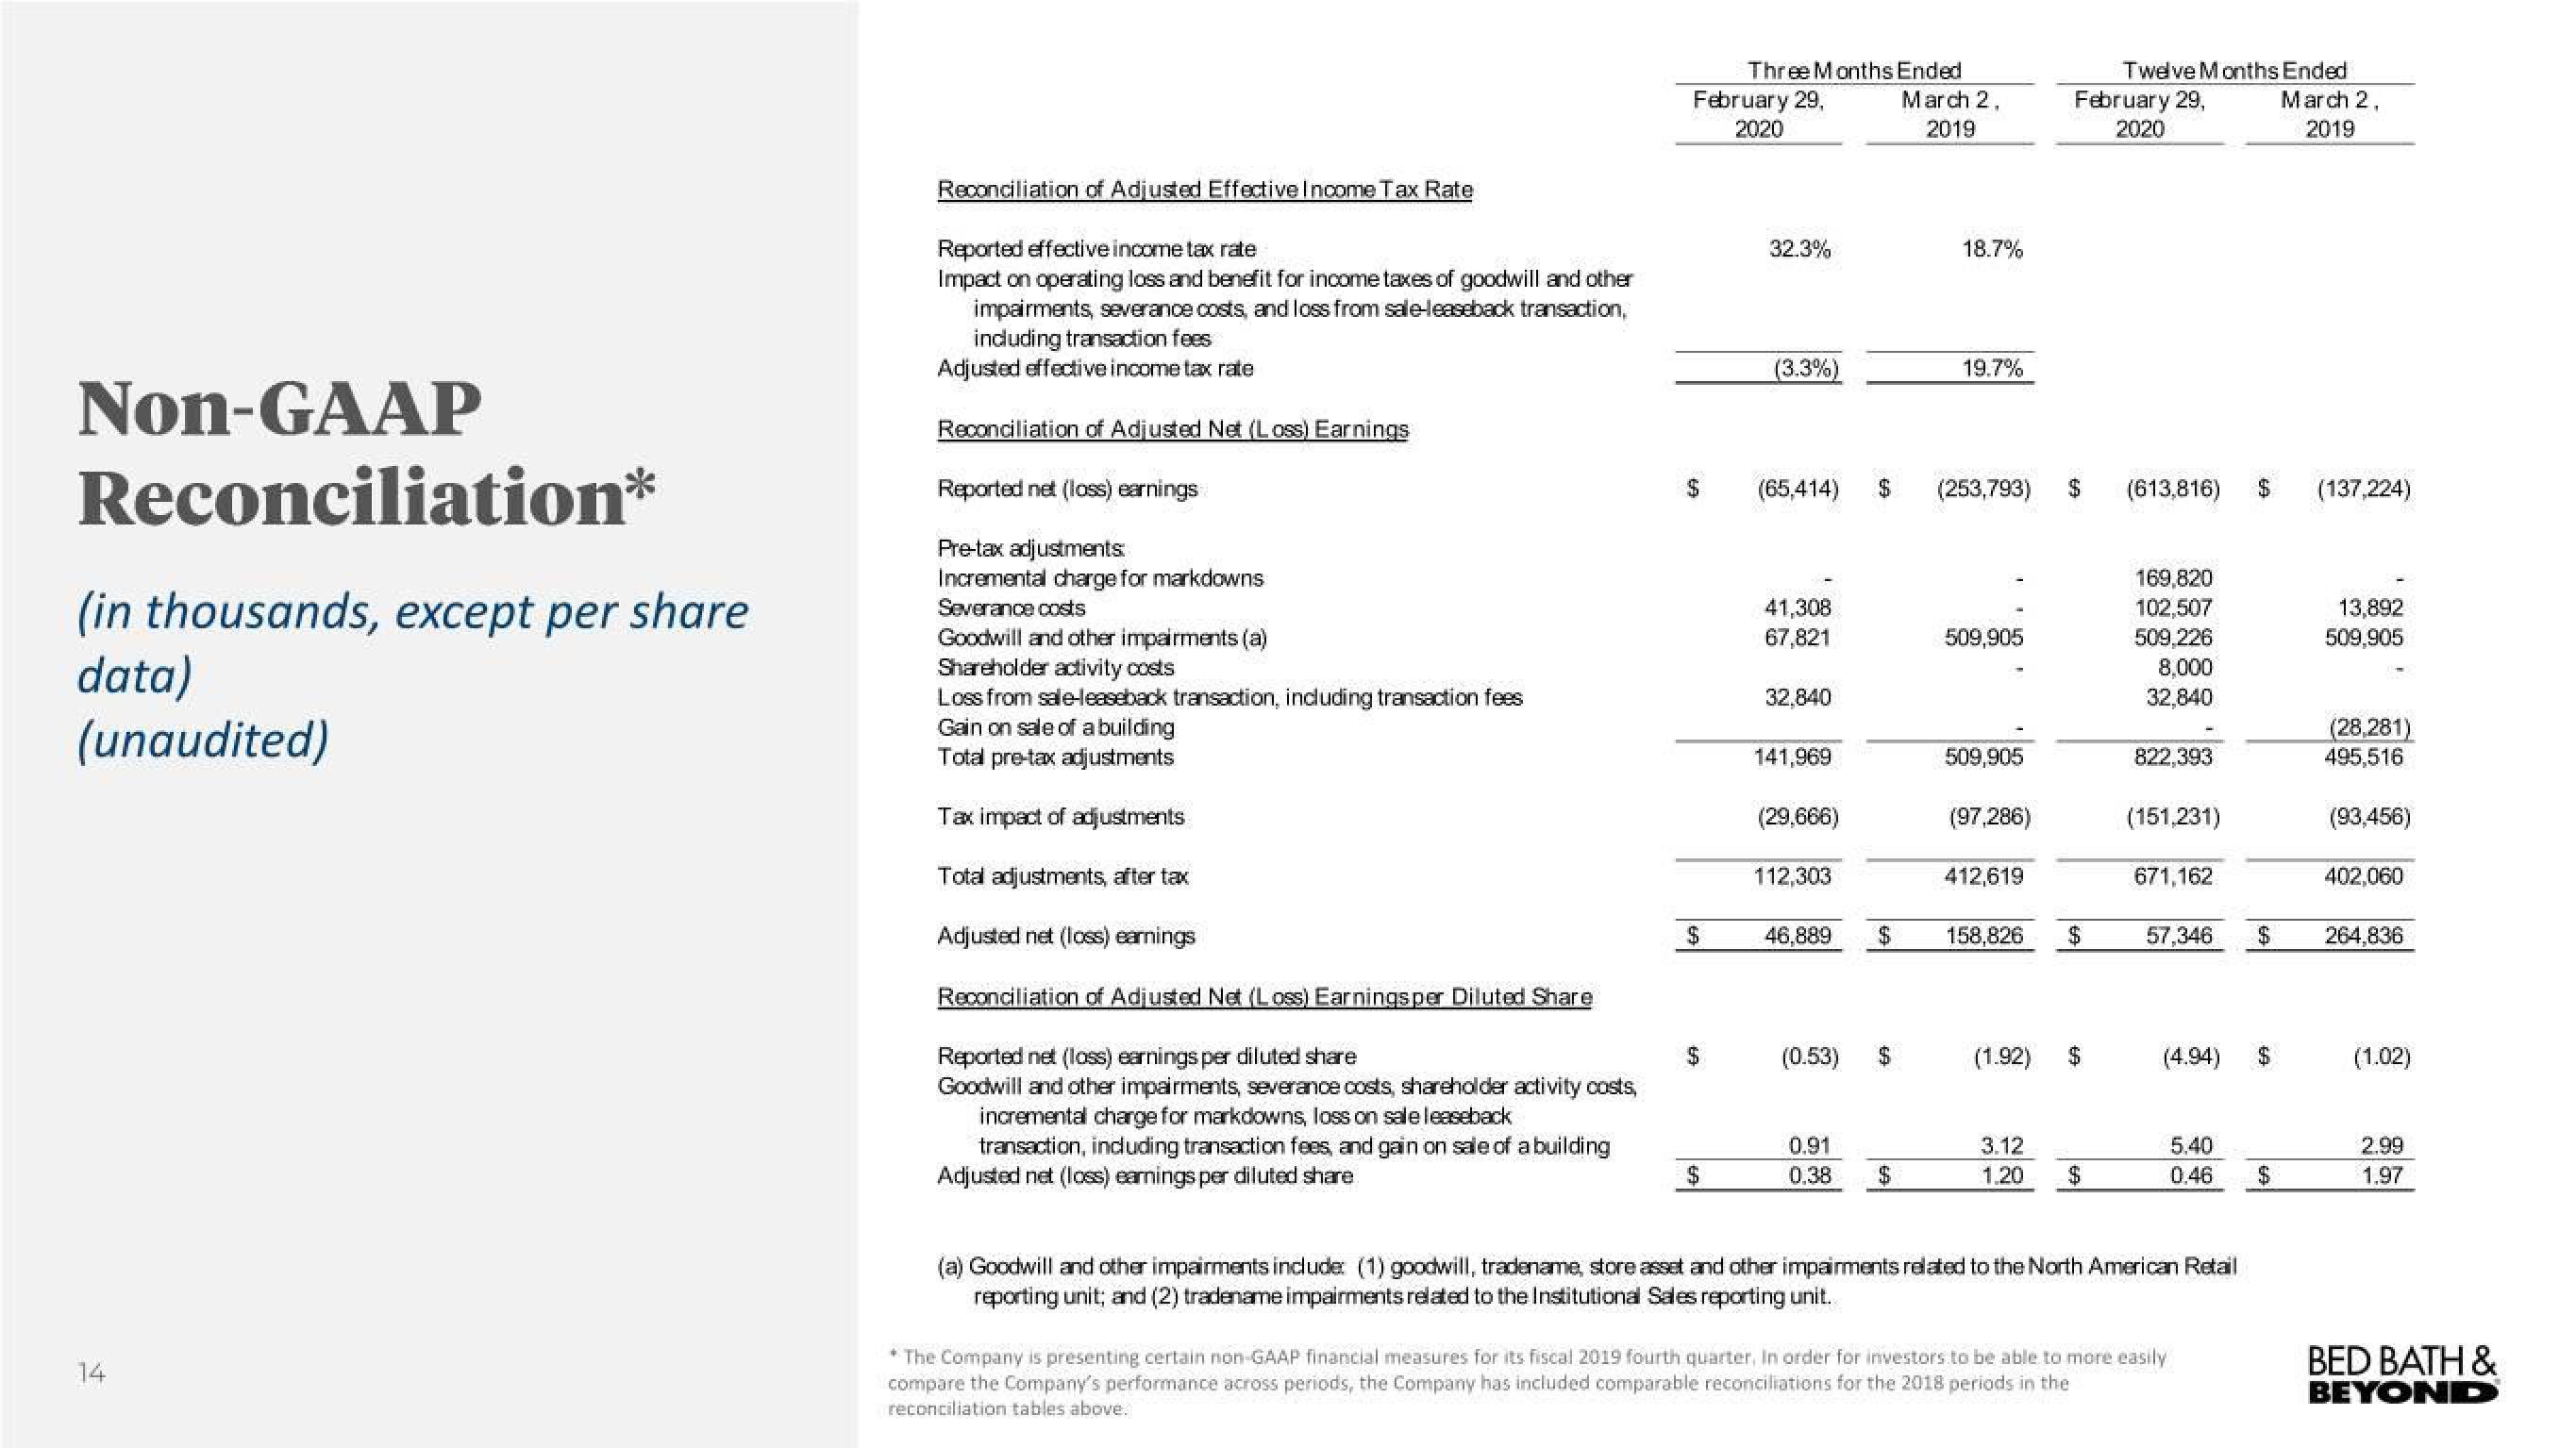
(a) Goodwill and other impairments include: (1) goodwill, tradename, store asset and other impairments related to the North American Retail
reporting unit; and (2) tradename impairments related to the Institutional Sales reporting unit.
* The Company is presenting certain non-GAAP financial measures for its fiscal 2019 fourth quarter, In order for investors to be able to more easily
compare the Company's performance across periods, the Company has included comparable reconciliations for the 2018 periods in the
reconciliation tables above.
$
$
(137,224)
13,892
509,905
(28,281)
495,516
(93,456)
402,060
264,836
(1.02)
2.99
1.97
BED BATH &
BEYONDView entire presentation