J.P.Morgan Investment Banking Pitch Book
APPENDIX
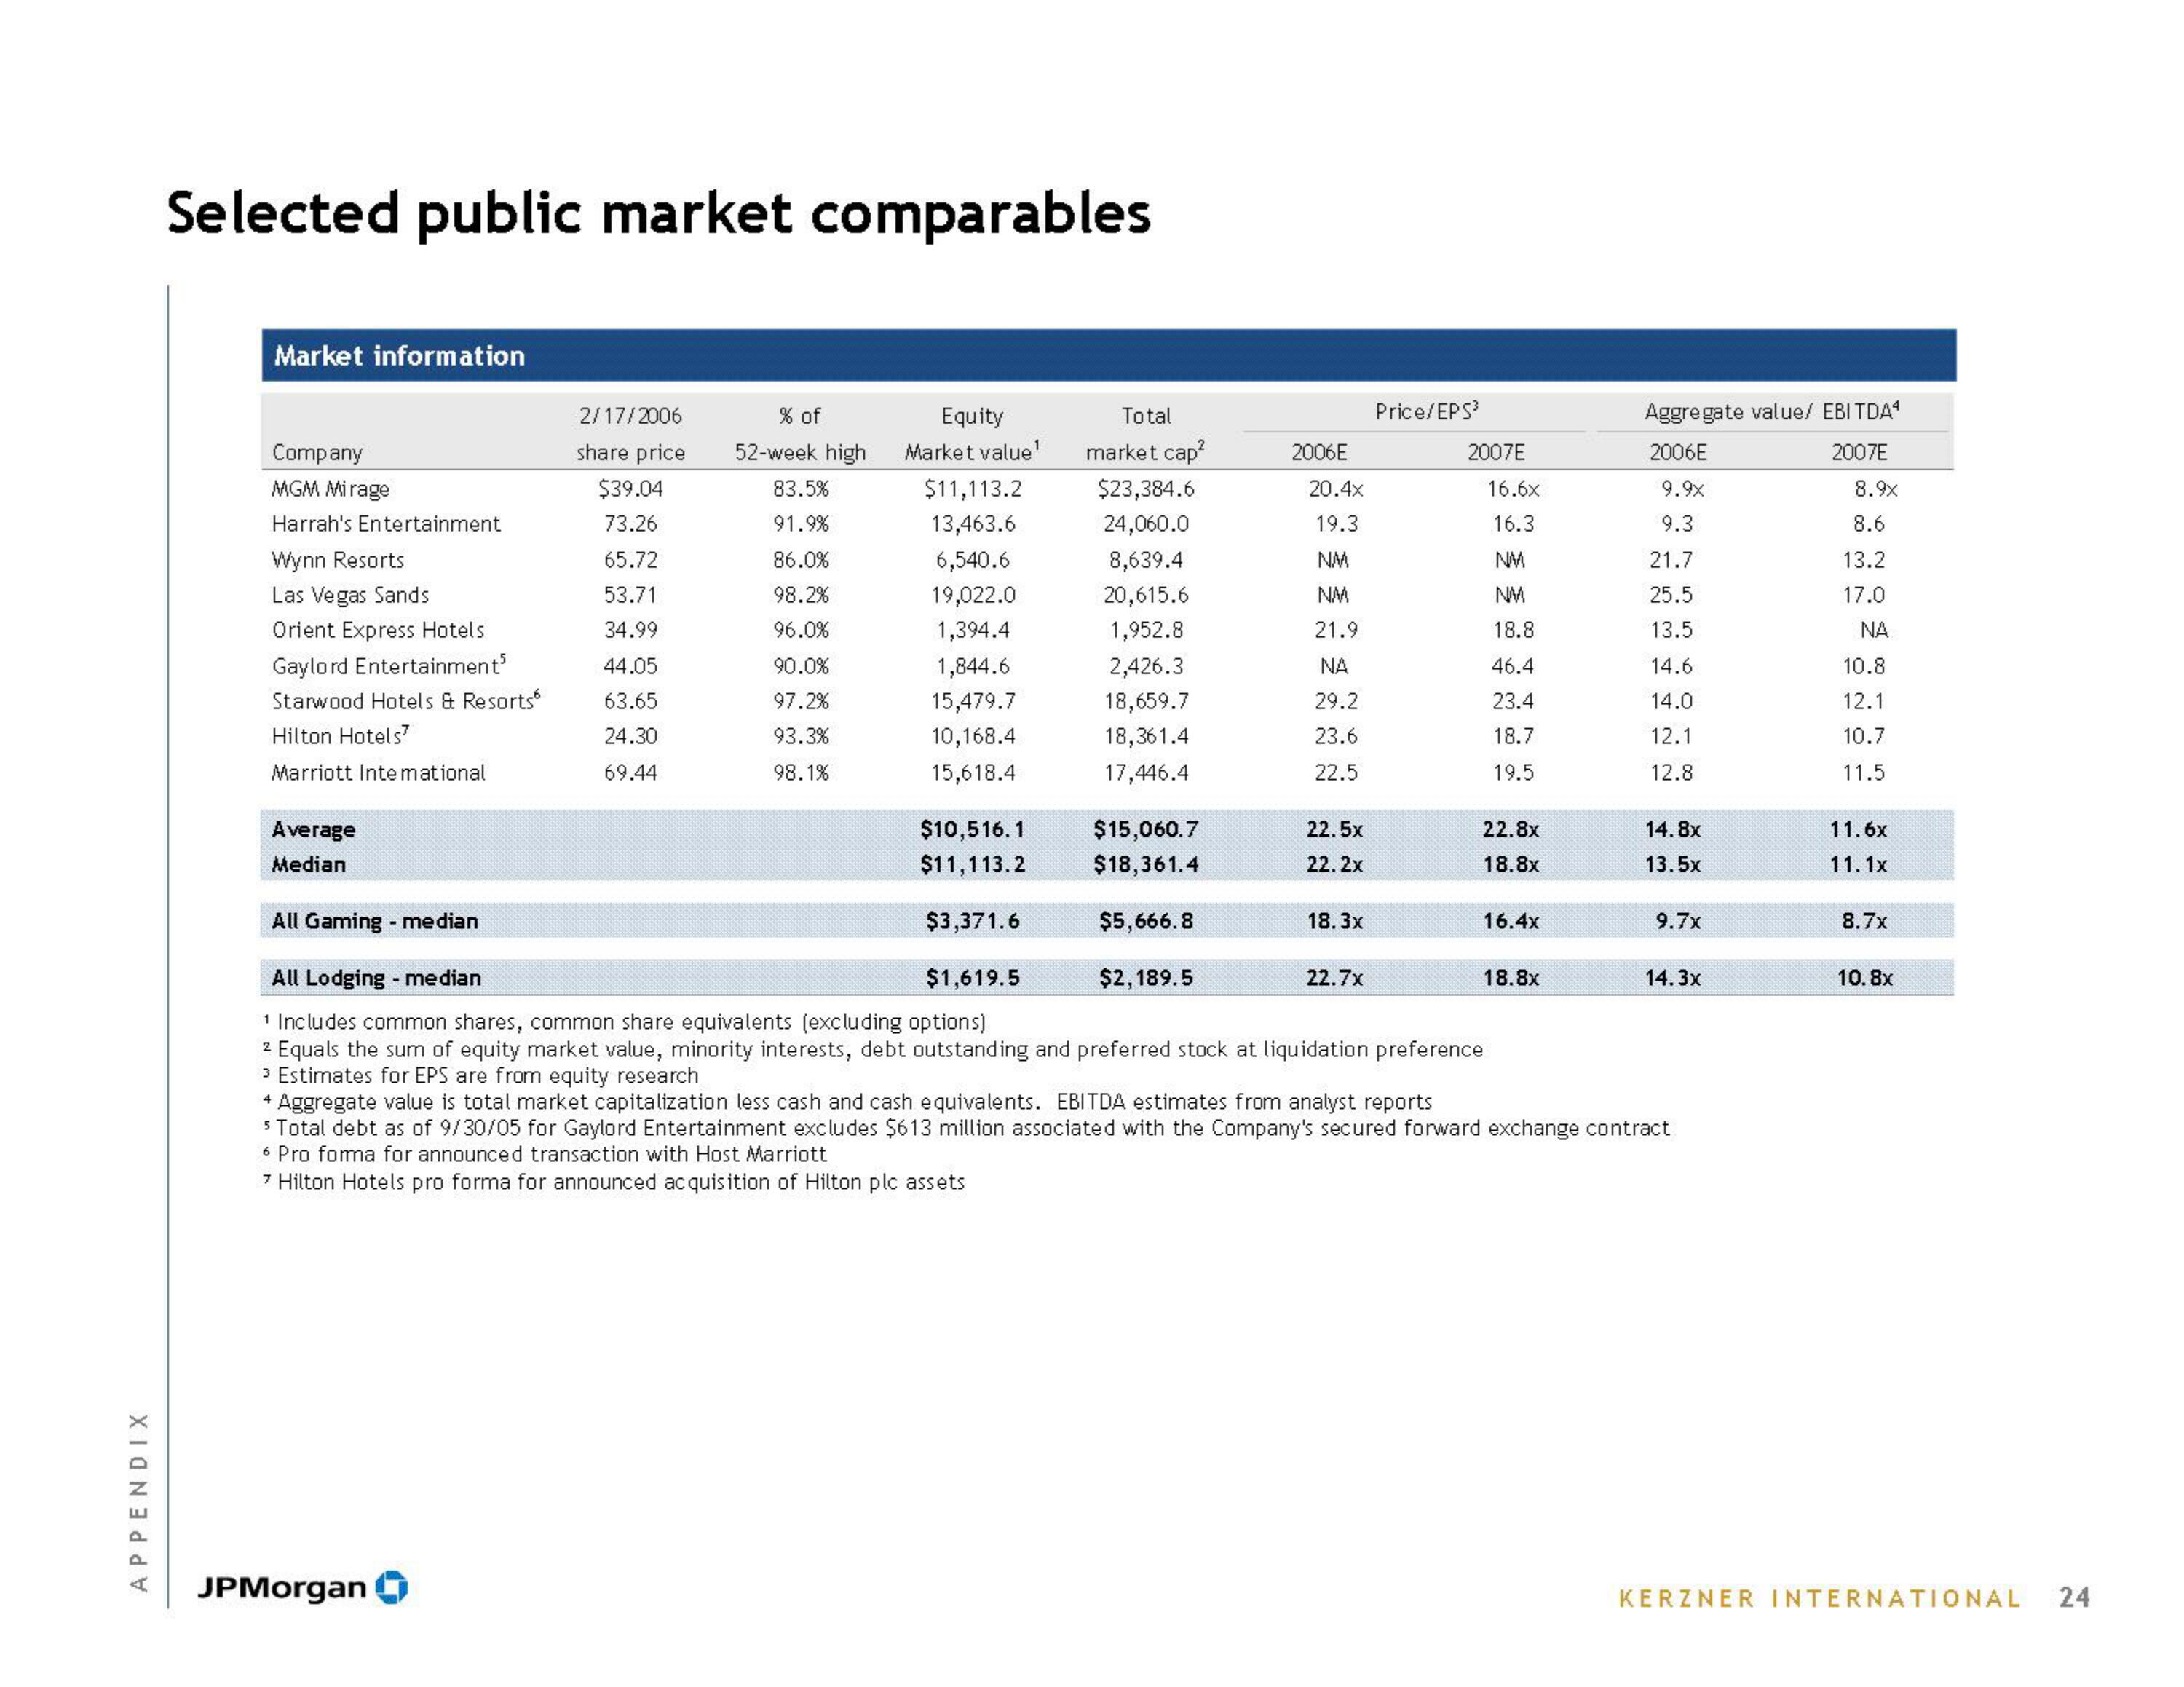
Selected public market comparables
Market information
Company
MGM Mirage
Harrah's Entertainment
Wynn Resorts
Las Vegas Sands
Orient Express Hotels
Gaylord Entertainment'
Starwood Hotels & Resorts
Hilton Hotels?
Marriott Inte mational
Average
Median
2/17/2006
share price
$39.04
73.26
JPMorgan
65.72
53.71
34.99
44.05
63.65
24.30
69.44
% of
52-week high
83.5%
91.9%
86.0%
98.2%
96.0%
90.0%
97.2%
93.3%
98.1%
Equity
Market value¹
$11,113.2
13,463.6
6,540.6
19,022.0
1,394.4
1,844.6
15,479.7
10,168.4
15,618.4
Total
market cap²
$23,384.6
24,060.0
8,639.4
20,615.6
1,952.8
2,426.3
18,659.7
18,361.4
17,446.4
$15,060.7
$18,361.4
$5,666.8
$2,189.5
2006E
20.4x
19.3
NM
NM
21.9
NA
29.2
23.6
22.5
22.5x
22. 2x
18.3x
Price/EPS³
$10,516.1
$11,113.2
All Gaming - median
$3,371.6
All Lodging - median
$1,619.5
¹ Includes common shares, common share equivalents (excluding options)
2 Equals the sum of equity market value, minority interests, debt outstanding and preferred stock at liquidation preference
3 Estimates for EPS are from equity research
4 Aggregate value is total market capitalization less cash and cash equivalents. EBITDA estimates from analyst reports
5 Total debt as of 9/30/05 for Gaylord Entertainment excludes $613 million associated with the Company's secured forward exchange contract
Pro forma for announced transaction with Host Marriott
7 Hilton Hotels pro forma for announced acquisition of Hilton plc assets
22.7x
2007E
16.6x
16.3
NM
NM
18.8
46.4
23.4
18.7
19.5
22.8x
18.8x
16.4x
Aggregate value/ EBITDA¹
2006E
2007E
9.9x
9.3
21.7
25.5
13.5
14.6
14.0
12.1
12.8
18.8x
14.8x
13.5x
9.7x
14.3x
8.9x
8.6
13.2
17.0
ΝΑ
10.8
12.1
10.7
11.5
11.6x
11.1x
8.7x
10.8x
KERZNER INTERNATIONAL 24View entire presentation