Babylon SPAC Presentation Deck
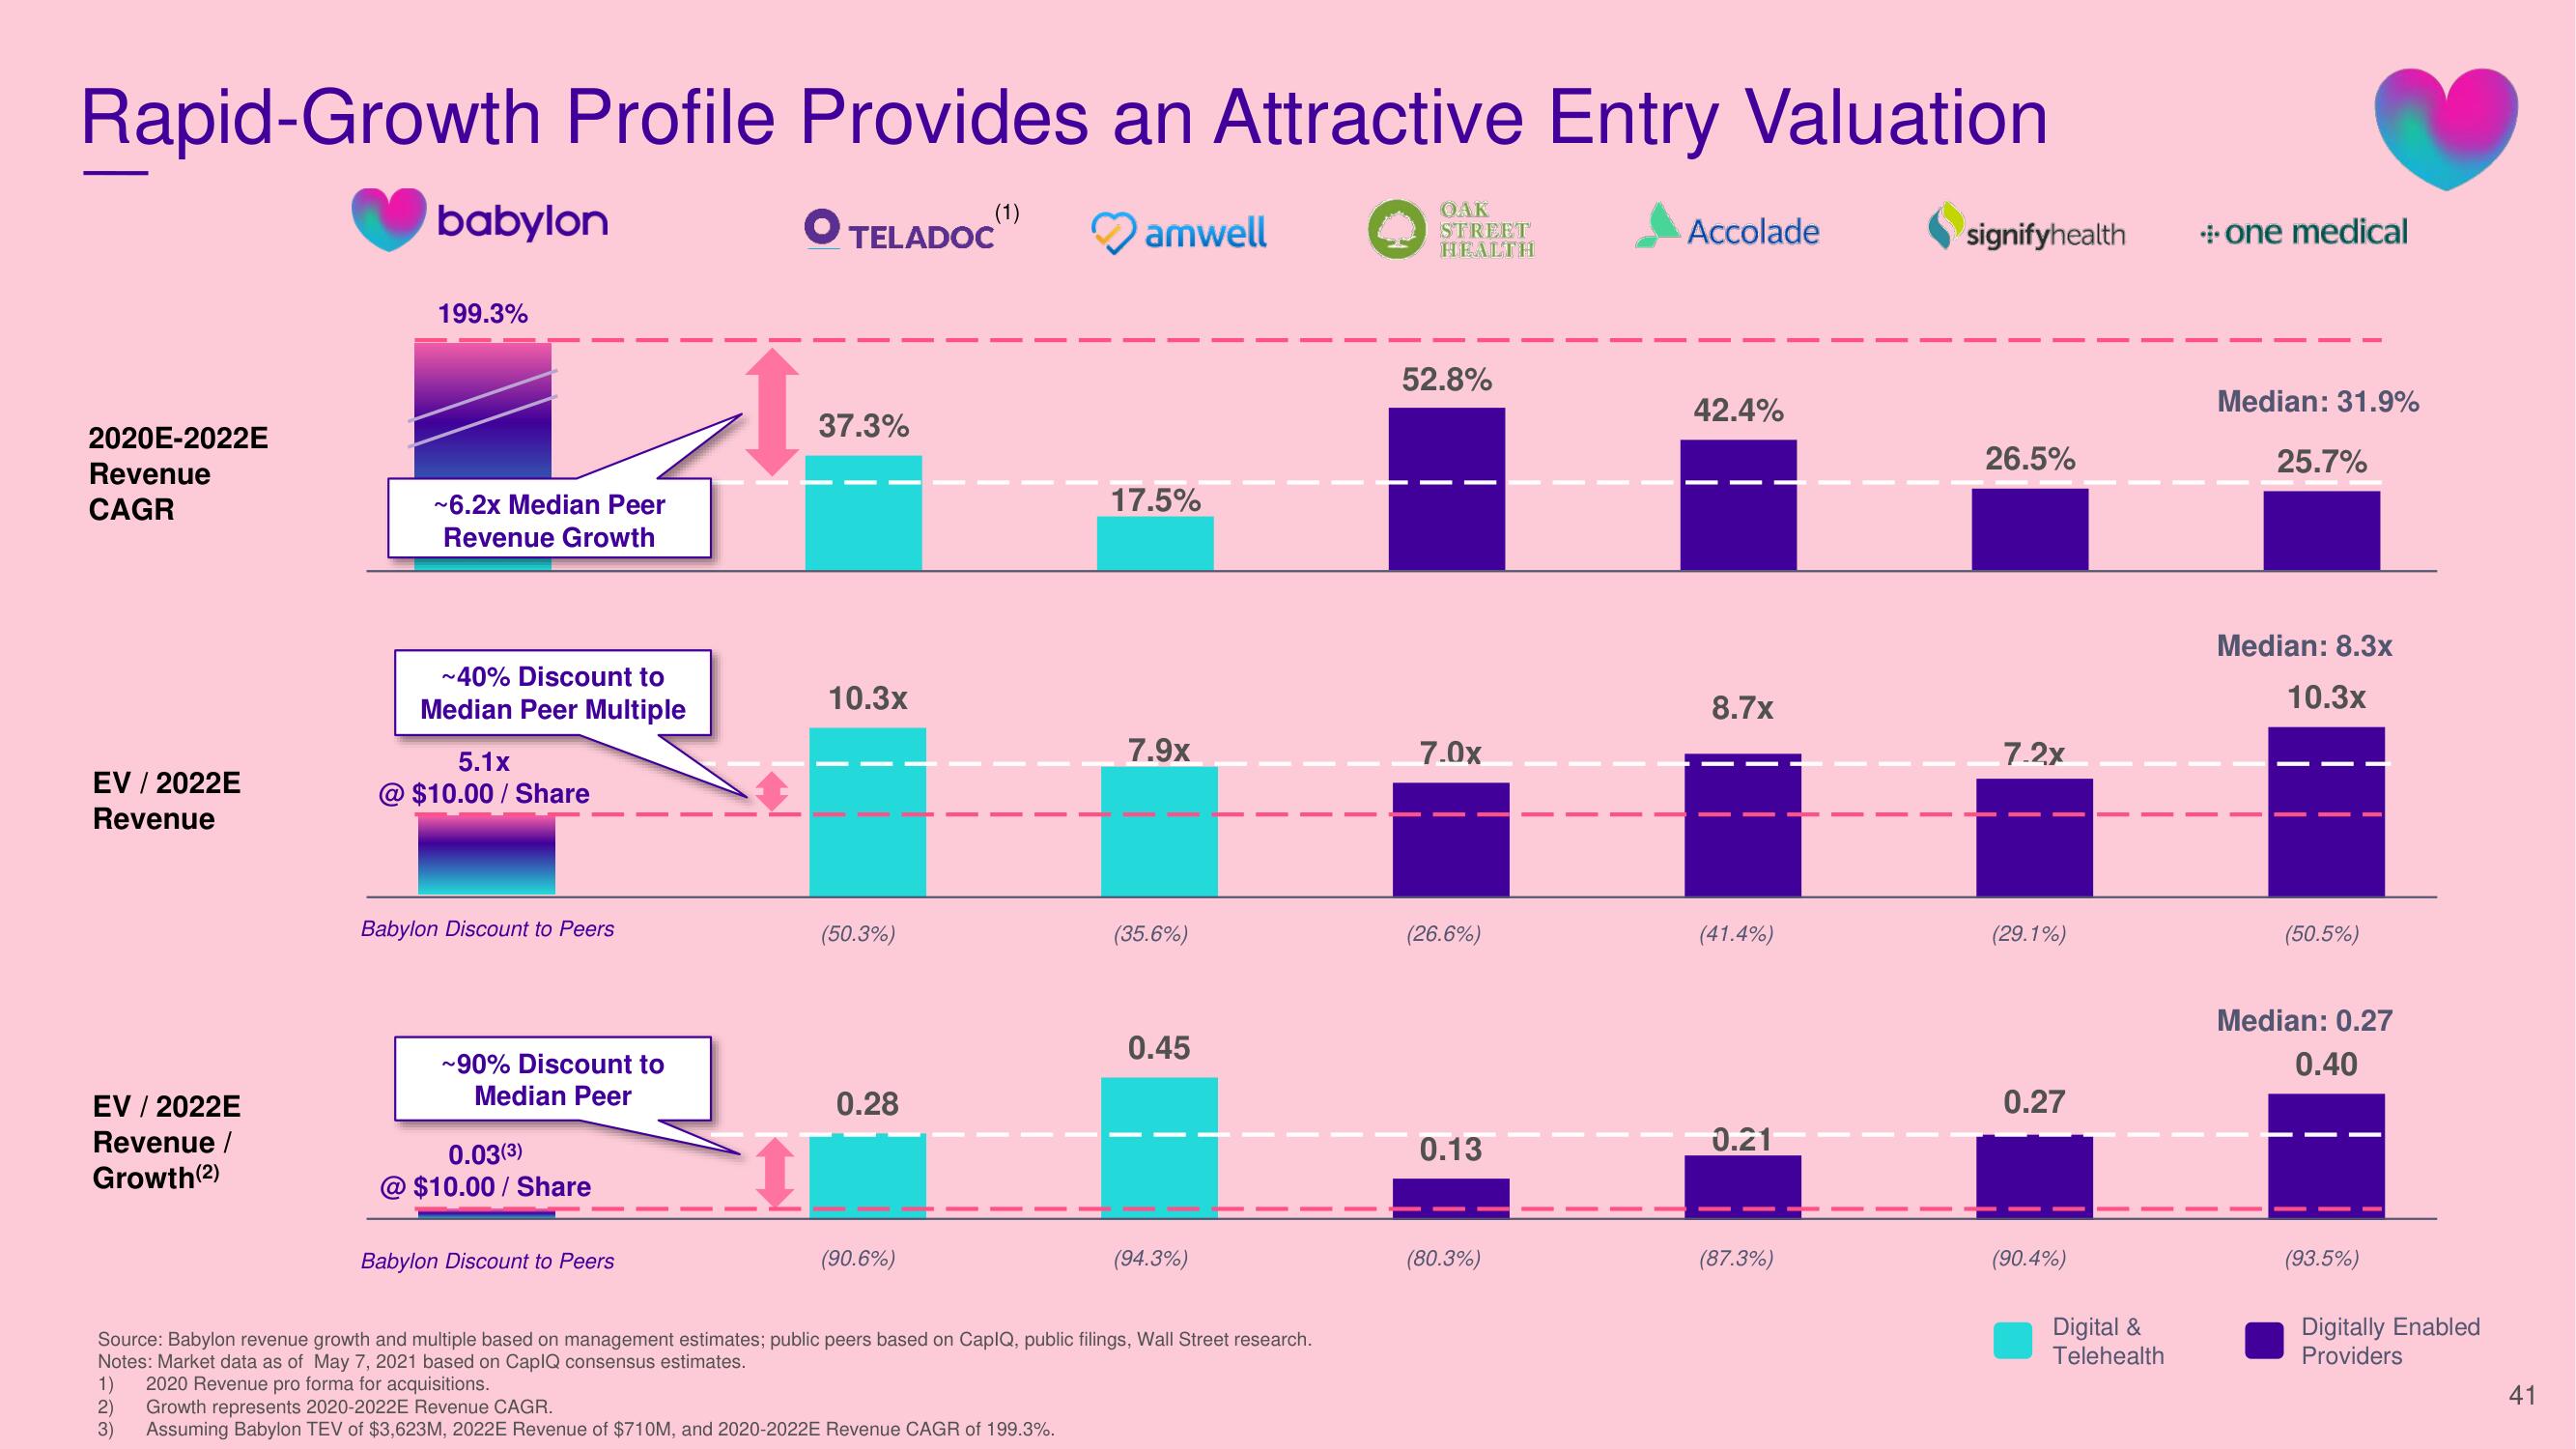
Rapid-Growth Profile Provides an Attractive Entry Valuation
TELADOC"¹
2020E-2022E
Revenue
CAGR
EV / 2022E
Revenue
EV / 2022E
Revenue /
Growth (2)
babylon
2)
3)
199.3%
~6.2x Median Peer
Revenue Growth
~40% Discount to
Median Peer Multiple
5.1x
@$10.00/Share
Babylon Discount to Peers
~90% Discount to
Median Peer
0.03(³3)
@$10.00/Share
Babylon Discount to Peers
O
37.3%
10.3x
(50.3%)
0.28
(90.6%)
amwell
Growth represents 2020-2022E Revenue CAGR.
Assuming Babylon TEV of $3,623M, 2022E Revenue of $710M, and 2020-2022E Revenue CAGR of 199.3%.
17.5%
7.9x
(35.6%)
0.45
Source: Babylon revenue growth and multiple based on management estimates; public peers based on CapIQ, public filings, Wall Street research.
Notes: Market data as of May 7, 2021 based on CapIQ consensus estimates.
1) 2020 Revenue pro forma for acquisitions.
(94.3%)
OAK
STREET
HEALTH
52.8%
7.0x
(26.6%)
0.13
(80.3%)
Accolade
42.4%
8.7x
(41.4%)
0.21
(87.3%)
signifyhealth
26.5%
7.2x
(29.1%)
0.27
(90.4%)
Digital &
Telehealth
• one medical
Median: 31.9%
25.7%
Median: 8.3x
10.3x
(50.5%)
Median: 0.27
0.40
(93.5%)
Digitally Enabled
Providers
41View entire presentation