Olaplex Investor Presentation Deck
OLAPLEX AT A GLANCE
Loyal Community
76%
of stylists believe OLAPLEX
offers higher quality
products than other brands
#1
follower count on Instagram
vs. similar brands
71 NPS
higher than average
across similar brands
Financial Profile
$598.4M
FY 2021 Net sales 4
Beloved Brand
#1
bond-building haircare
brand in professional
#1
brand on Amazon
in haircare³
#1
haircare brand in 2021
at Sephora
112%
FY 2021 Net sales growth
Exceptional Profile
3 Based on company beliefs and sales estimates.
4 FY 2021 period refers to the 12-months ended December 31, 2021.
12
Products²
60+
Countries
worldwide
100+
Employees
68.3%
FY 2021 Adj. EBITDA margin
Note: For a reconciliation of Adjusted EBITDA to net income, please refer to the appendix of this presentation.
112 month period ended December 31, 2021.
2 Product count excludes kits and trial sizes.
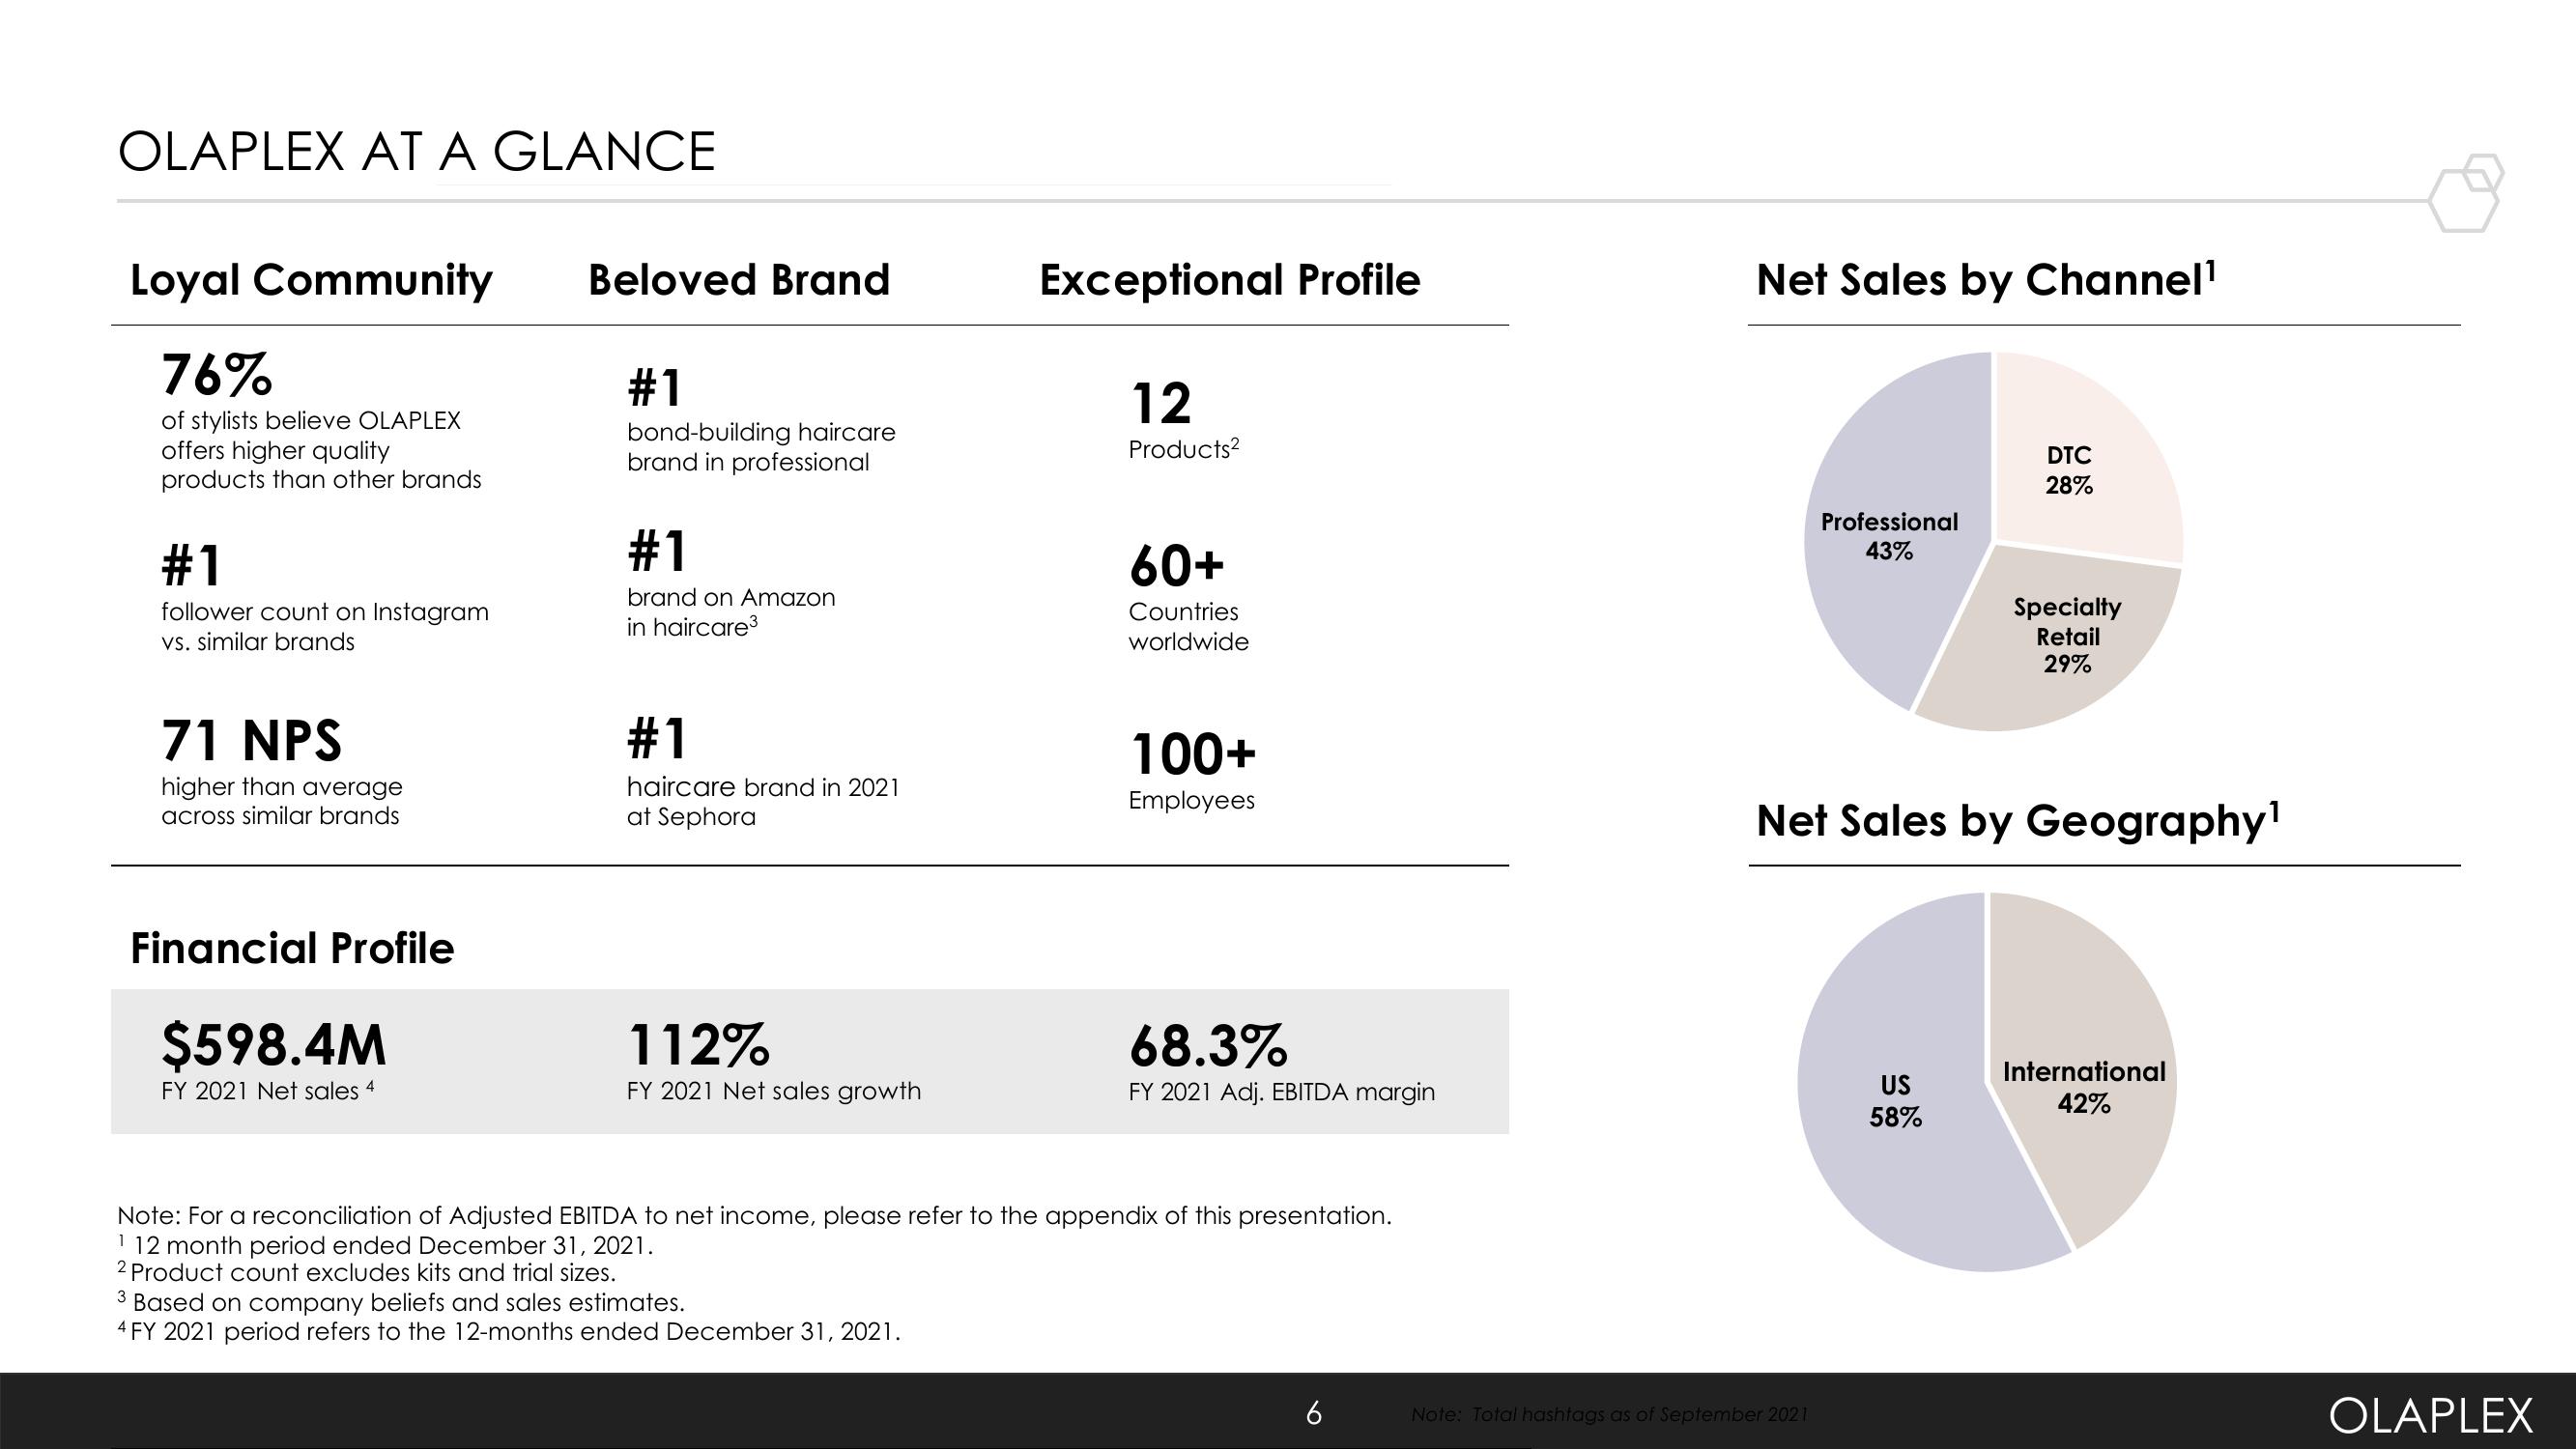
Net Sales by Channel¹
Professional
43%
Note: Total hashtags as of September 2021
DTC
28%
Net Sales by Geography¹
US
58%
Specialty
Retail
29%
International
42%
OLAPLEXView entire presentation