Disney Investor Presentation Deck
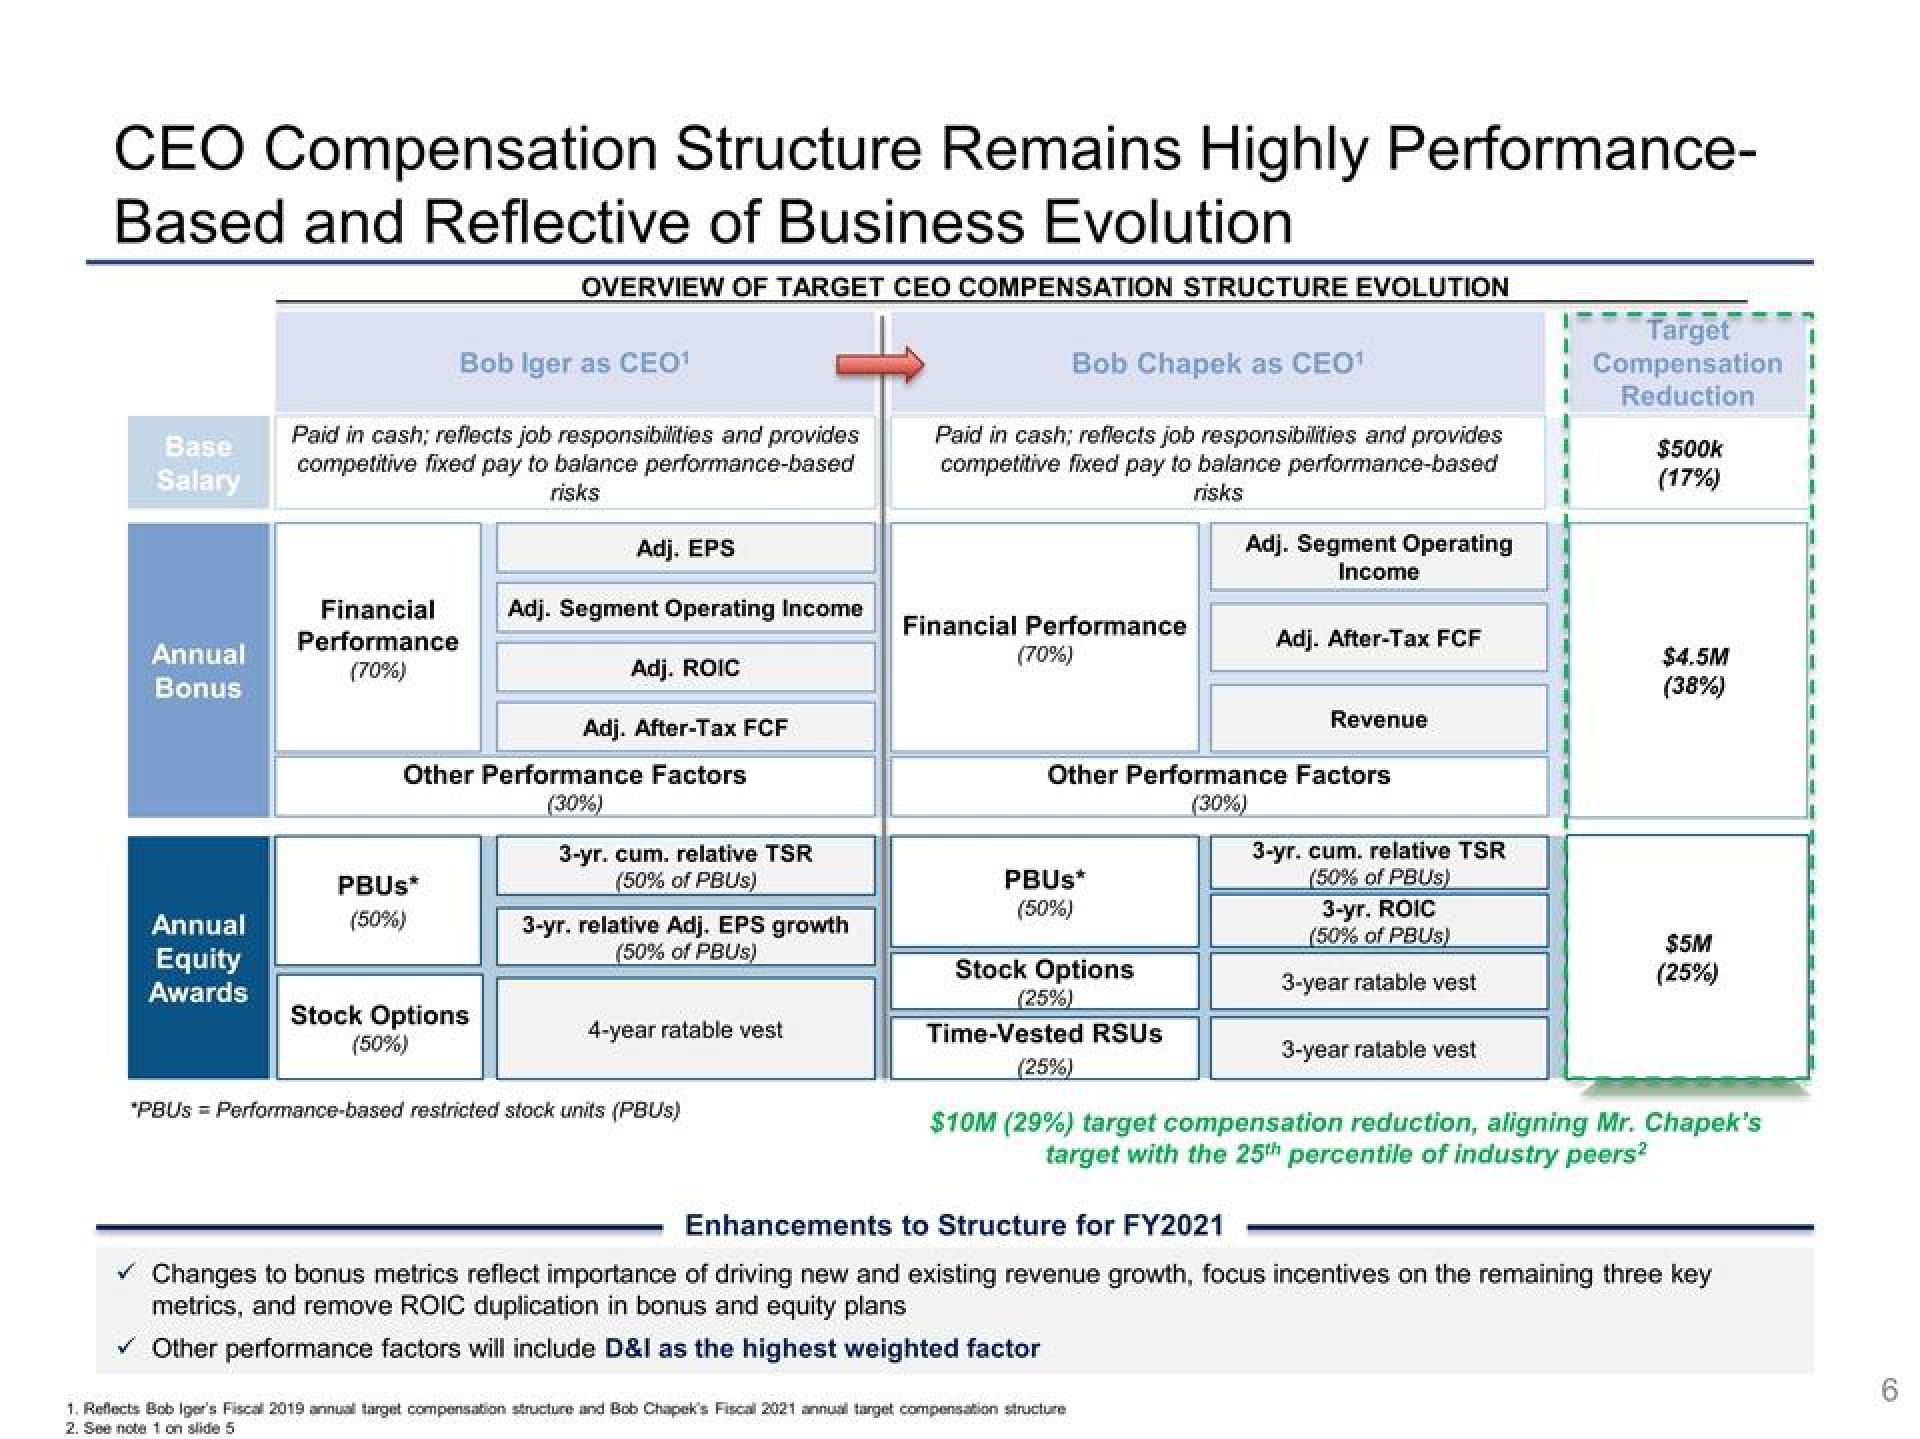
CEO Compensation Structure Remains Highly Performance-
Based and Reflective of Business Evolution
OVERVIEW OF TARGET CEO COMPENSATION STRUCTURE EVOLUTION
Base
Salary
Annual
Bonus
Annual
Equity
Awards
Bob Iger as CEO¹
Paid in cash; reflects job responsibilities and provides
competitive fixed pay to balance performance-based
risks
Financial
Performance
(70%)
PBUS*
(50%)
Adj. EPS
Adj. Segment Operating Income
Adj. ROIC
Other Performance Factors
(30%)
Stock Options
(50%)
Adj. After-Tax FCF
3-yr. cum. relative TSR
(50% of PBUS)
3-yr. relative Adj. EPS growth
(50% of PBUS)
4-year ratable vest
*PBUS = Performance-based restricted stock units (PBUS)
Bob Chapek as CEO¹
Paid in cash; reflects job responsibilities and provides
competitive fixed pay to balance performance-based
risks
Financial Performance
(70%)
PBUS*
(50%)
Stock Options
(25%)
Adj. Segment Operating
Income
Other Performance Factors
(30%)
Adj. After-Tax FCF
Revenue
1. Reflects Bob Iger's Fiscal 2019 annual target compensation structure and Bob Chapek's Fiscal 2021 annual target compensation structure
2. See note 1 on slide 5
3-yr. cum. relative TSR
(50% of PBUS)
3-yr. ROIC
(50% of PBUS)
3-year ratable vest
Target
Compensation
Reduction
3-year ratable vest
$500k
(17%)
$4.5M
(38%)
Time-Vested RSUS
(25%)
$10M (29%) target compensation reduction, aligning Mr. Chapek's
target with the 25th percentile of industry peers²
$5M
(25%)
Enhancements to Structure for FY2021
✓ Changes to bonus metrics reflect importance of driving new and existing revenue growth, focus incentives on the remaining three key
metrics, and remove ROIC duplication in bonus and equity plans
✓ Other performance factors will include D&I as the highest weighted factor
(2)View entire presentation