Kinnevik Results Presentation Deck
Intro
Net Asset Value
A STABLE BUT FRAGILE START TO 2023
In H1 2023, the Nasdaq 100 had one of its best starts of the year ever,
returning almost 40 percent. Around 90 percent of the gain was propelled
by the large tech giants. This concentration of returns was underpinned by
positive sentiment around these businesses' earnings prowess, "do more
with less" messaging, and perhaps most importantly their showcasing
of real-world applications of artificial intelligence. Beneath these mega
caps, stock market performance was more mixed and less uniformly
positive. This is reflected in our unlisted portfolio's peer universe, in which
the weighted-average share price movement was up in low-single digit
percentages during the quarter, compared to a 4 percent decline in the
underlying valuations of our private businesses.
We saw minor positive movements in our software peers and more
muted developments elsewhere in our comparable universe. We exert
some caution in reflecting H1 2023 public market multiple expansion in
valuing our businesses considering the still prevailing market uncerta-
inty and the continued increase in correlation between profitability and
valuation multiples. As a consequence, the average premiums ascribed
to our faster growing businesses has shrunk meaningfully during 2023 to
date. In Q2, the weighted-average peer multiple remained unchanged
compared to 3 percent multiple contraction in our unlisted portfolio.
Key revisions of financial outlooks in this quarter pertain to Oda closing
its operations in Germany and Finland, and of Village MD consolidating its
footprint to accelerate profitability after the acquisition of Summit Health.
Elsewhere in the private portfolio, expectations on growth rates and
profitability remained largely unchanged on average. When factoring in
changes in the private portfolio's composition in the quarter, the average
expected growth rate of the portfolio remained unchanged in the quarter
even with the downward adjustments of forecasts at Oda and VillageMD.
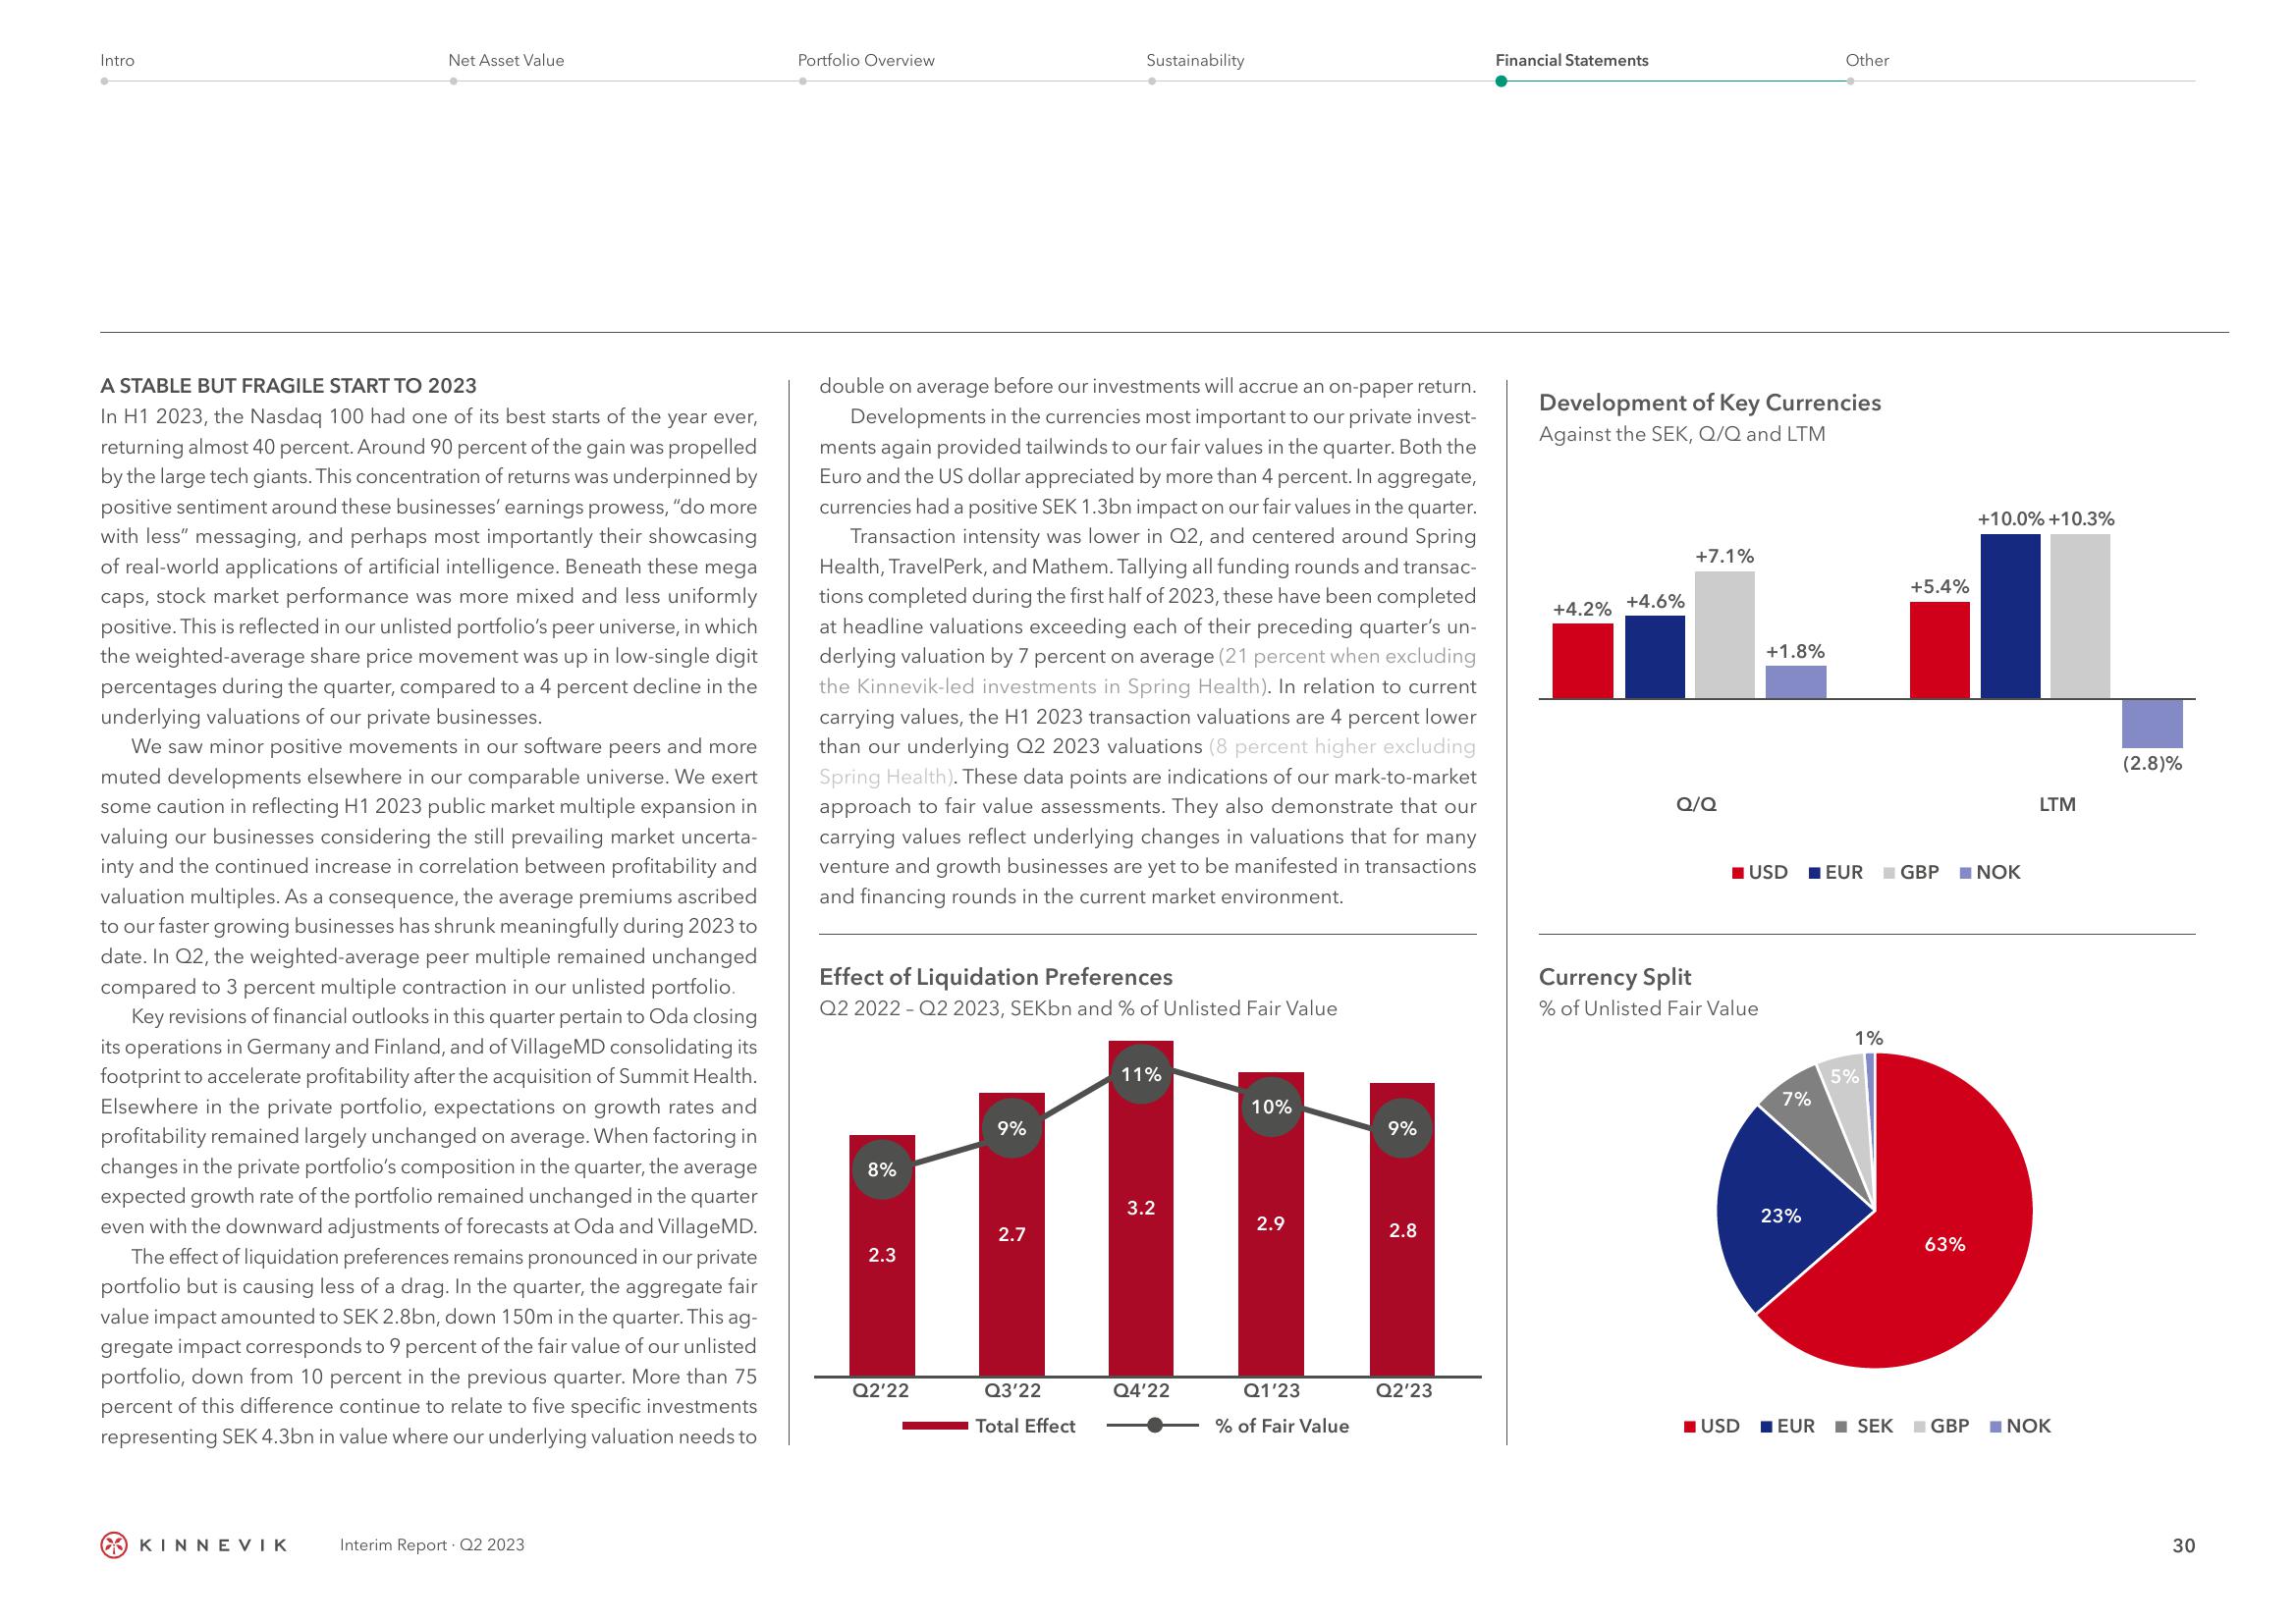
The effect of liquidation preferences remains pronounced in our private
portfolio but is causing less of a drag. In the quarter, the aggregate fair
value impact amounted to SEK 2.8bn, down 150m in the quarter. This ag-
gregate impact corresponds to 9 percent of the fair value of our unlisted
portfolio, down from 10 percent in the previous quarter. More than 75
percent of this difference continue to relate to five specific investments
representing SEK 4.3bn in value where our underlying valuation needs to
KINNEVIK
Interim Report Q2 2023
Portfolio Overview
double on average before our investments will accrue an on-paper return.
Developments in the currencies most important to our private invest-
ments again provided tailwinds to our fair values in the quarter. Both the
Euro and the US dollar appreciated by more than 4 percent. In aggregate,
currencies had a positive SEK 1.3bn impact on our fair values in the quarter.
Transaction intensity was lower in Q2, and centered around Spring
Health, TravelPerk, and Mathem. Tallying all funding rounds and transac-
tions completed during the first half of 2023, these have been completed
at headline valuations exceeding each of their preceding quarter's un-
derlying valuation by 7 percent on average (21 percent when excluding
the Kinnevik-led investments in Spring Health). In relation to current
carrying values, the H1 2023 transaction valuations are 4 percent lower
than our underlying Q2 2023 valuations (8 percent higher excluding
Spring Health). These data points are indications of our mark-to-market
approach to fair value assessments. They also demonstrate that our
carrying values reflect underlying changes in valuations that for many
venture and growth businesses are yet to be manifested in transactions
and financing rounds in the current market environment.
Effect of Liquidation Preferences
Q2 2022-Q2 2023, SEKbn and % of Unlisted Fair Value
8%
2.3
Q2'22
9%
Sustainability
2.7
Q3'22
Total Effect
11%
3.2
Q4'22
10%
2.9
Q1'23
% of Fair Value
9%
2.8
Q2'23
Financial Statements
Development of Key Currencies
Against the SEK, Q/Q and LTM
+4.2%
+4.6%
+7.1%
Q/Q
Currency Split
% of Unlisted Fair Value
USD
+1.8%
Other
USD EUR GBP
7%
23%
1%
5%
+5.4%
EUR SEK
63%
GBP
+10.0% +10.3%
NOK
LTM
NOK
(2.8)%
30View entire presentation