Tesla Results Presentation Deck
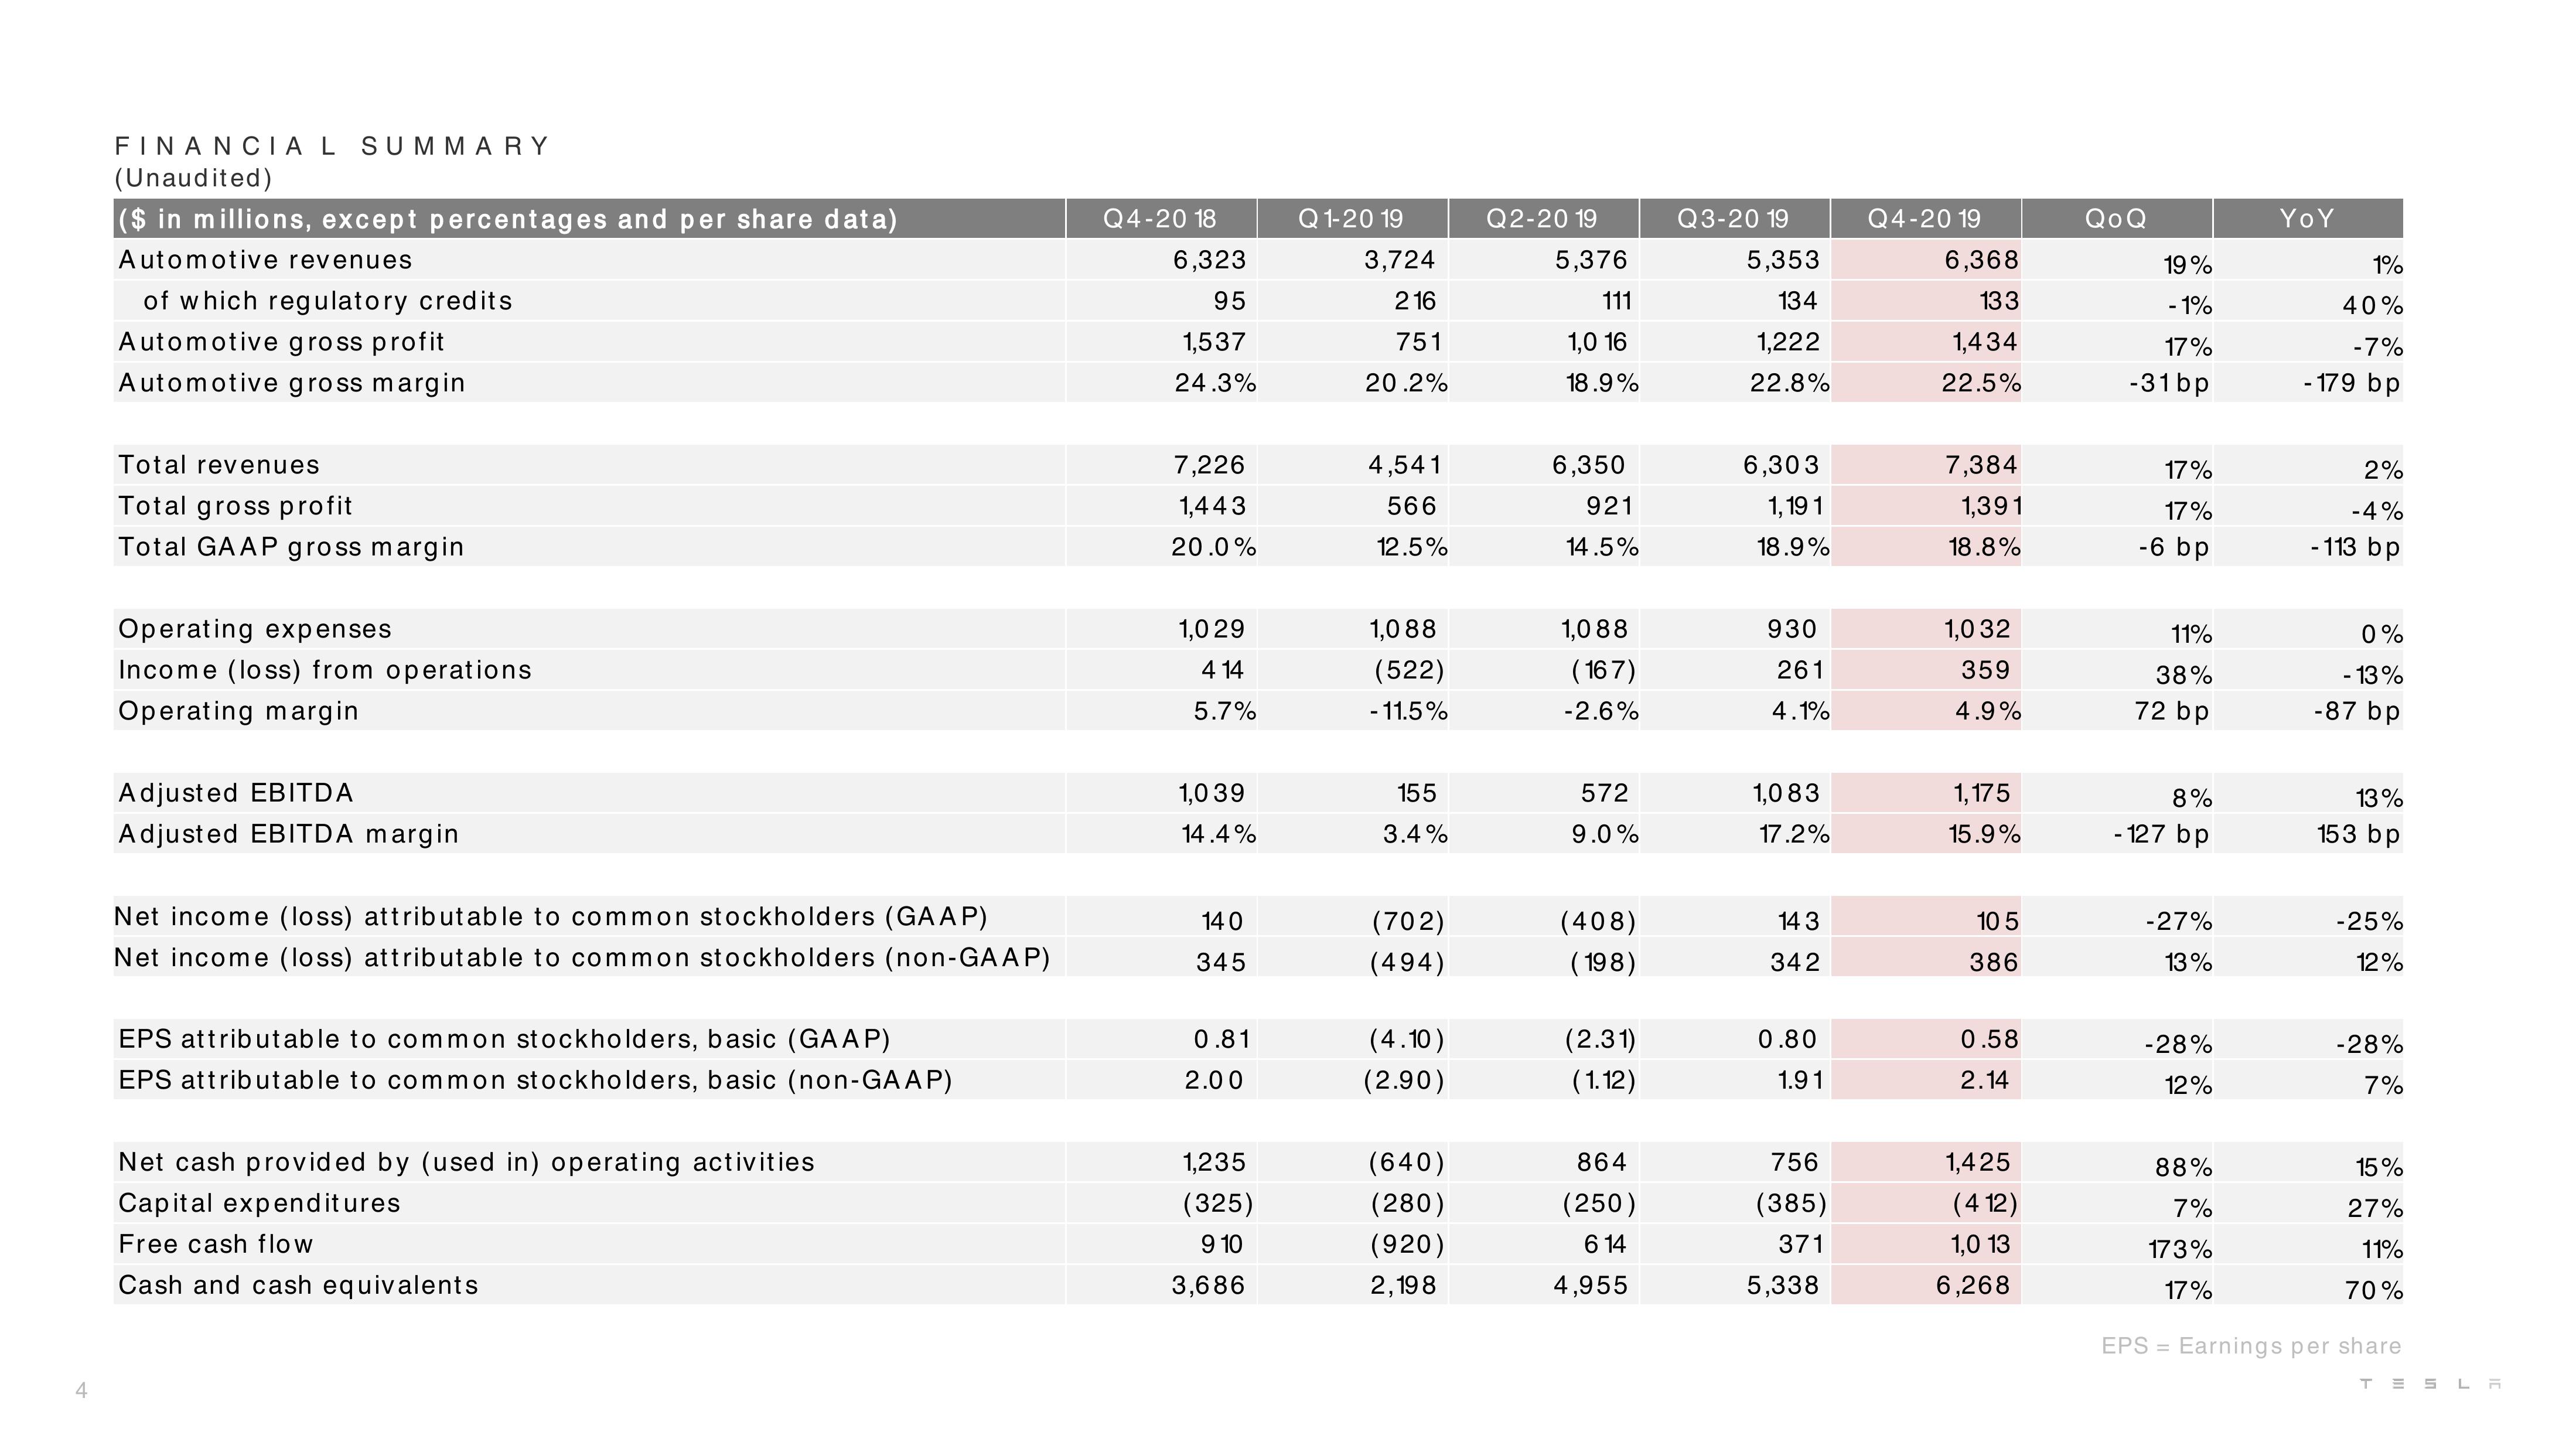
FINANCIAL SUMMARY
(Unaudited)
($ in millions, except percentages and per share data)
Automotive revenues
of which regulatory credits
Automotive gross profit
Automotive gross margin
Total revenues
Total gross profit
Total GAAP gross margin
Operating expenses
Income (loss) from operations
Operating margin
Adjusted EBITDA
Adjusted EBITDA margin
Net income (loss) attributable to common stockholders (GAAP)
Net income (loss) attributable to common stockholders (non-GAAP)
EPS attributable to common stockholders, basic (GAAP)
EPS attributable to common stockholders, basic (non-GAAP)
Net cash provided by (used in) operating activities
Capital expenditures
Free cash flow
Cash and cash equivalents
Q4-20 18
6,323
95
1,537
24.3%
7,226
1,443
20.0%
1,029
4 14
5.7%
1,039
14.4%
14 0
345
0.81
2.00
1,235
(325)
9 10
3,686
Q1-20 19
3,724
216
751
20.2%
4,541
566
12.5%
1,088
(522)
- 11.5%
155
3.4%
(702)
(494)
(4.10)
(2.90)
(640)
(280)
(920)
2,198
Q2-20 19
5,376
111
1,0 16
18.9%
6,350
921
14.5%
1,088
(167)
-2.6%
572
9.0%
(408)
(198)
(2.31)
(1.12)
864
(250)
6 14
4,955
Q3-20 19
5,353
134
1,222
22.8%
6,303
1,19 1
18.9%
930
261
4.1%
1,083
17.2%
14 3
342
0.80
1.91
756
(385)
371
5,338
Q4-20 19
6,368
133
1,434
22.5%
7,384
1,391
18.8%
1,0 32
359
4.9%
1,175
15.9%
10 5
386
0.58
2.14
1,425
(412)
1,0 13
6,268
QoQ
19%
- 1%
17%
-31bp
17%
17%
-6 bp
11%
38%
72 bp
8%
- 127 bp
-27%
13%
-28%
12%
88%
7%
173%
17%
Yo Y
1%
40%
-7%
-179 bp
2%
-4%
-113 bp
0%
- 13%
-87 bp
13%
153 bp
-25%
12%
-28%
7%
15%
27%
11%
70%
EPS = Earnings per share
TESLAView entire presentation