TPG Results Presentation Deck
Pro Forma After-Tax DE and Dividends Per Share
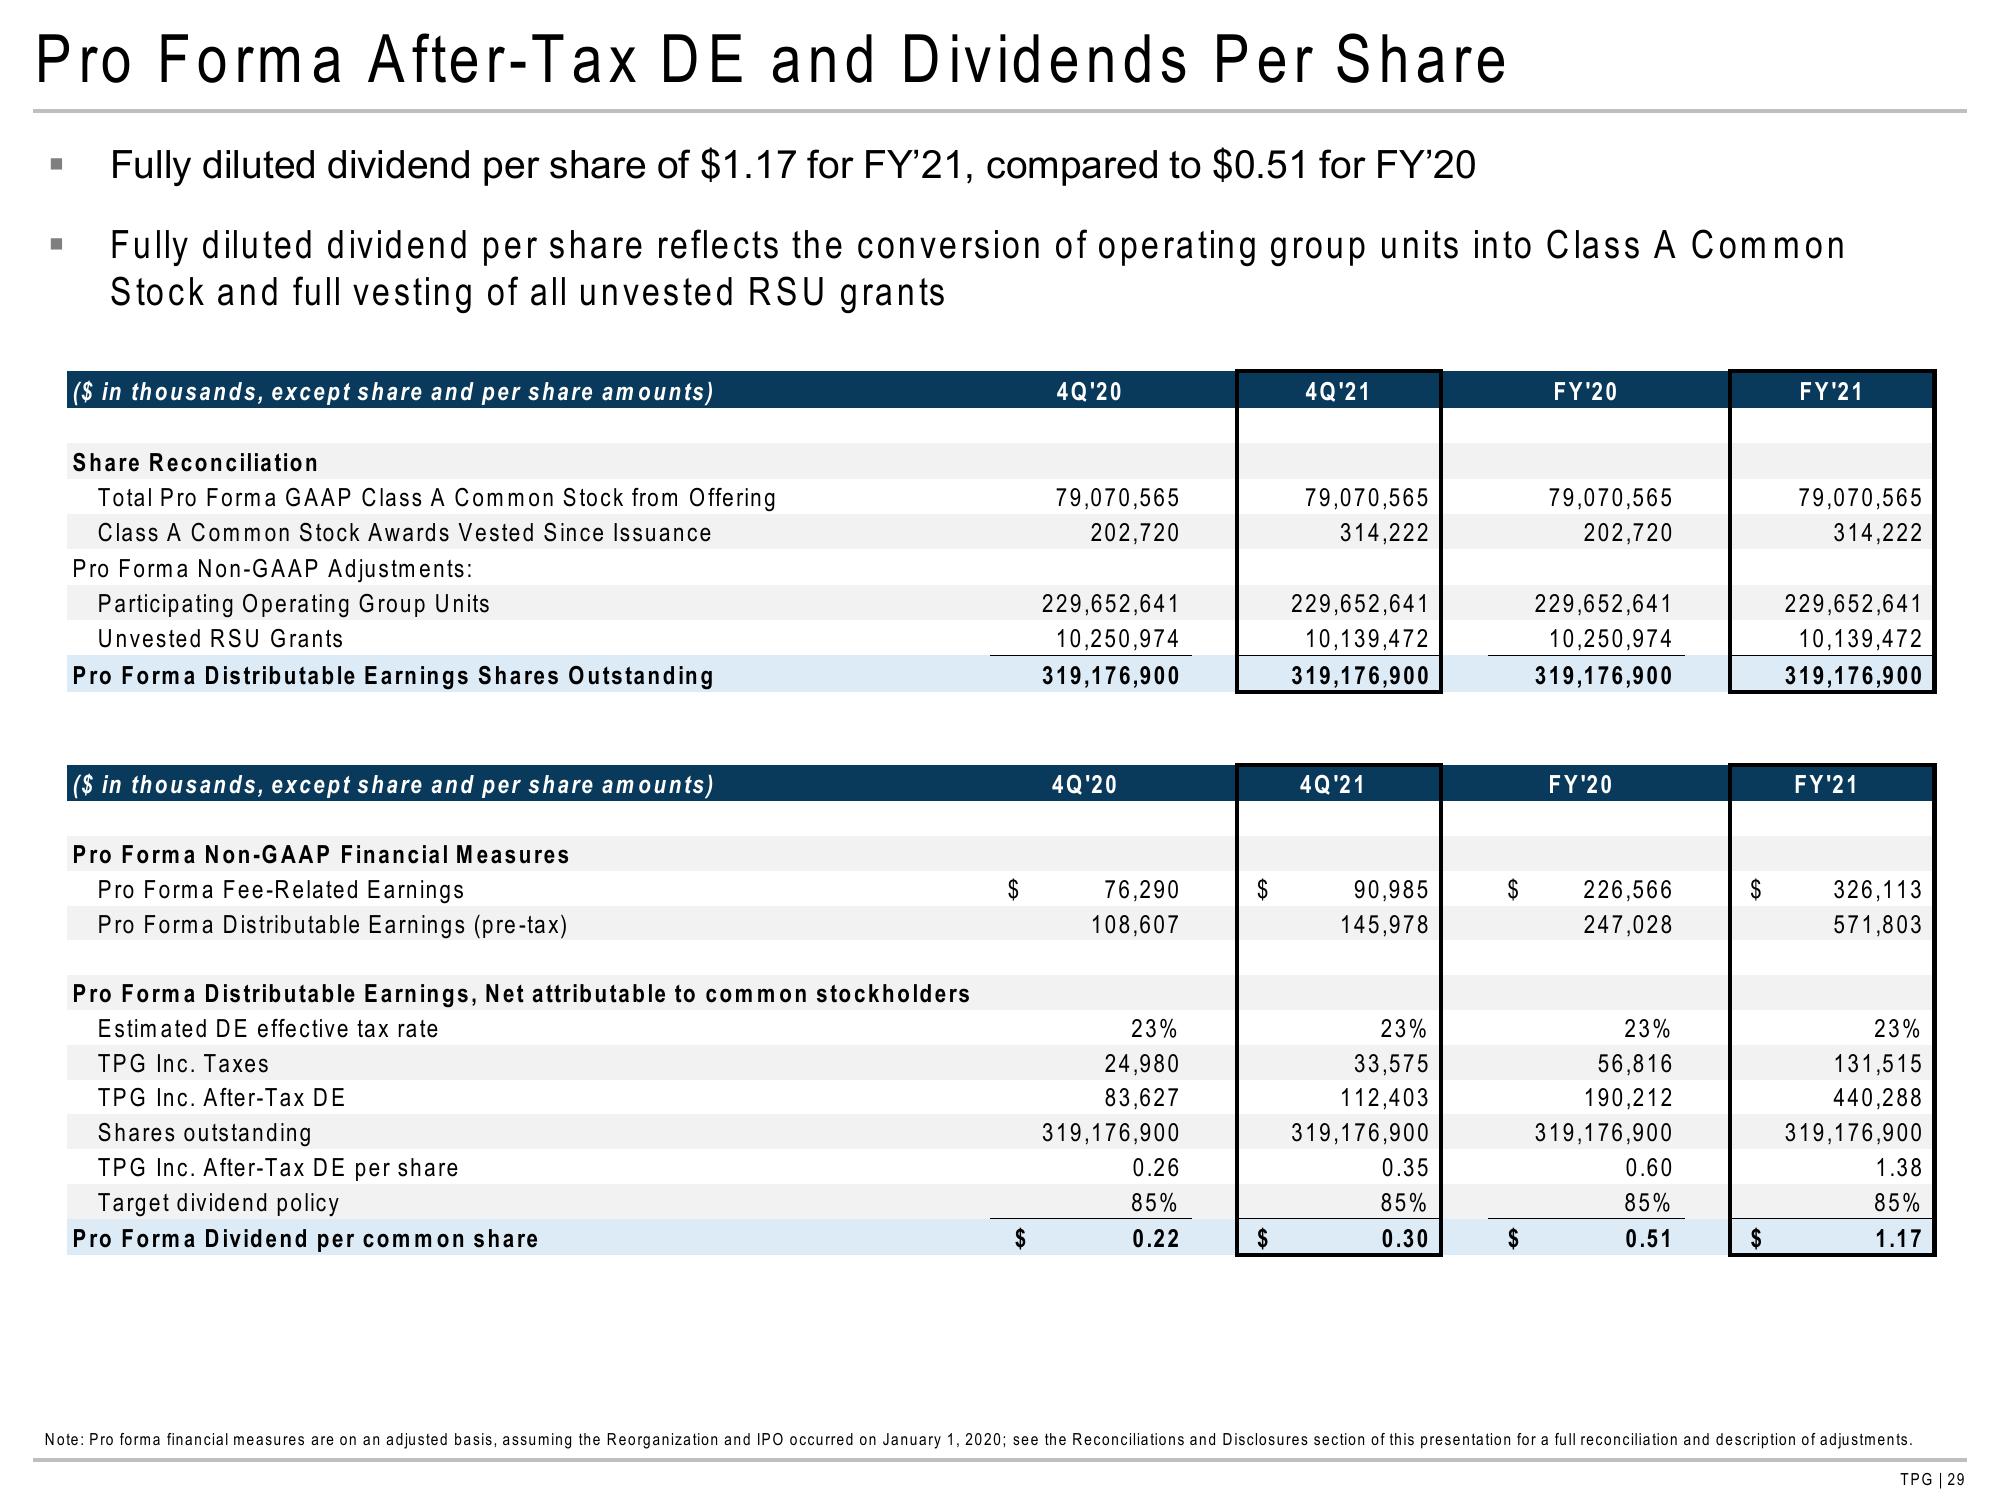
Fully diluted dividend per share of $1.17 for FY'21, compared to $0.51 for FY'20
Fully diluted dividend per share reflects the conversion of operating group units into Class A Common
Stock and full vesting of all unvested RSU grants
I
I
($ in thousands, except share and per share amounts)
SI
Reconciliation
Total Pro Forma GAAP Class A Common Stock from Offering
Class A Common Stock Awards Vested Since Issuance
Pro Forma Non-GAAP Adjustments:
Participating Operating Group Units
Unvested RSU Grants
Pro Forma Distributable Earnings Shares Outstanding
($ in thousands, except share and per share amounts)
Pro Forma Non-GAAP Financial Measures
Pro Forma Fee-Related Earnings
Pro Forma Distributable Earnings (pre-tax)
Pro Forma Distributable Earnings, Net attributable to common stockholders
Estimated DE effective tax rate
TPG Inc. Taxes
TPG Inc. After-Tax DE
Shares outstanding
TPG Inc. After-Tax DE per share
Target dividend policy
Pro Forma Dividend per common share
$
$
4Q'20
79,070,565
202,720
229,652,641
10,250,974
319,176,900
4Q'20
76,290
108,607
23%
24,980
83,627
319,176,900
0.26
85%
0.22
$
$
4Q'21
79,070,565
314,222
229,652,641
10,139,472
319,176,900
4Q'21
90,985
145,978
23%
33,575
112,403
319,176,900
0.35
85%
0.30
$
$
FY¹20
79,070,565
202,720
229,652,641
10,250,974
319,176,900
FY'20
226,566
247,028
23%
56,816
190,212
319,176,900
0.60
85%
0.51
$
$
FY'21
79,070,565
314,222
229,652,641
10,139,472
319,176,900
FY'21
326,113
571,803
23%
131,515
440,288
319,176,900
1.38
85%
1.17
Note: Pro forma financial measures are on an adjusted basis, assuming the Reorganization and IPO occurred on January 1, 2020; see the Reconciliations and Disclosures section of this presentation for a full reconciliation and description of adjustments.
TPG | 29View entire presentation