Carlyle Investor Day Presentation Deck
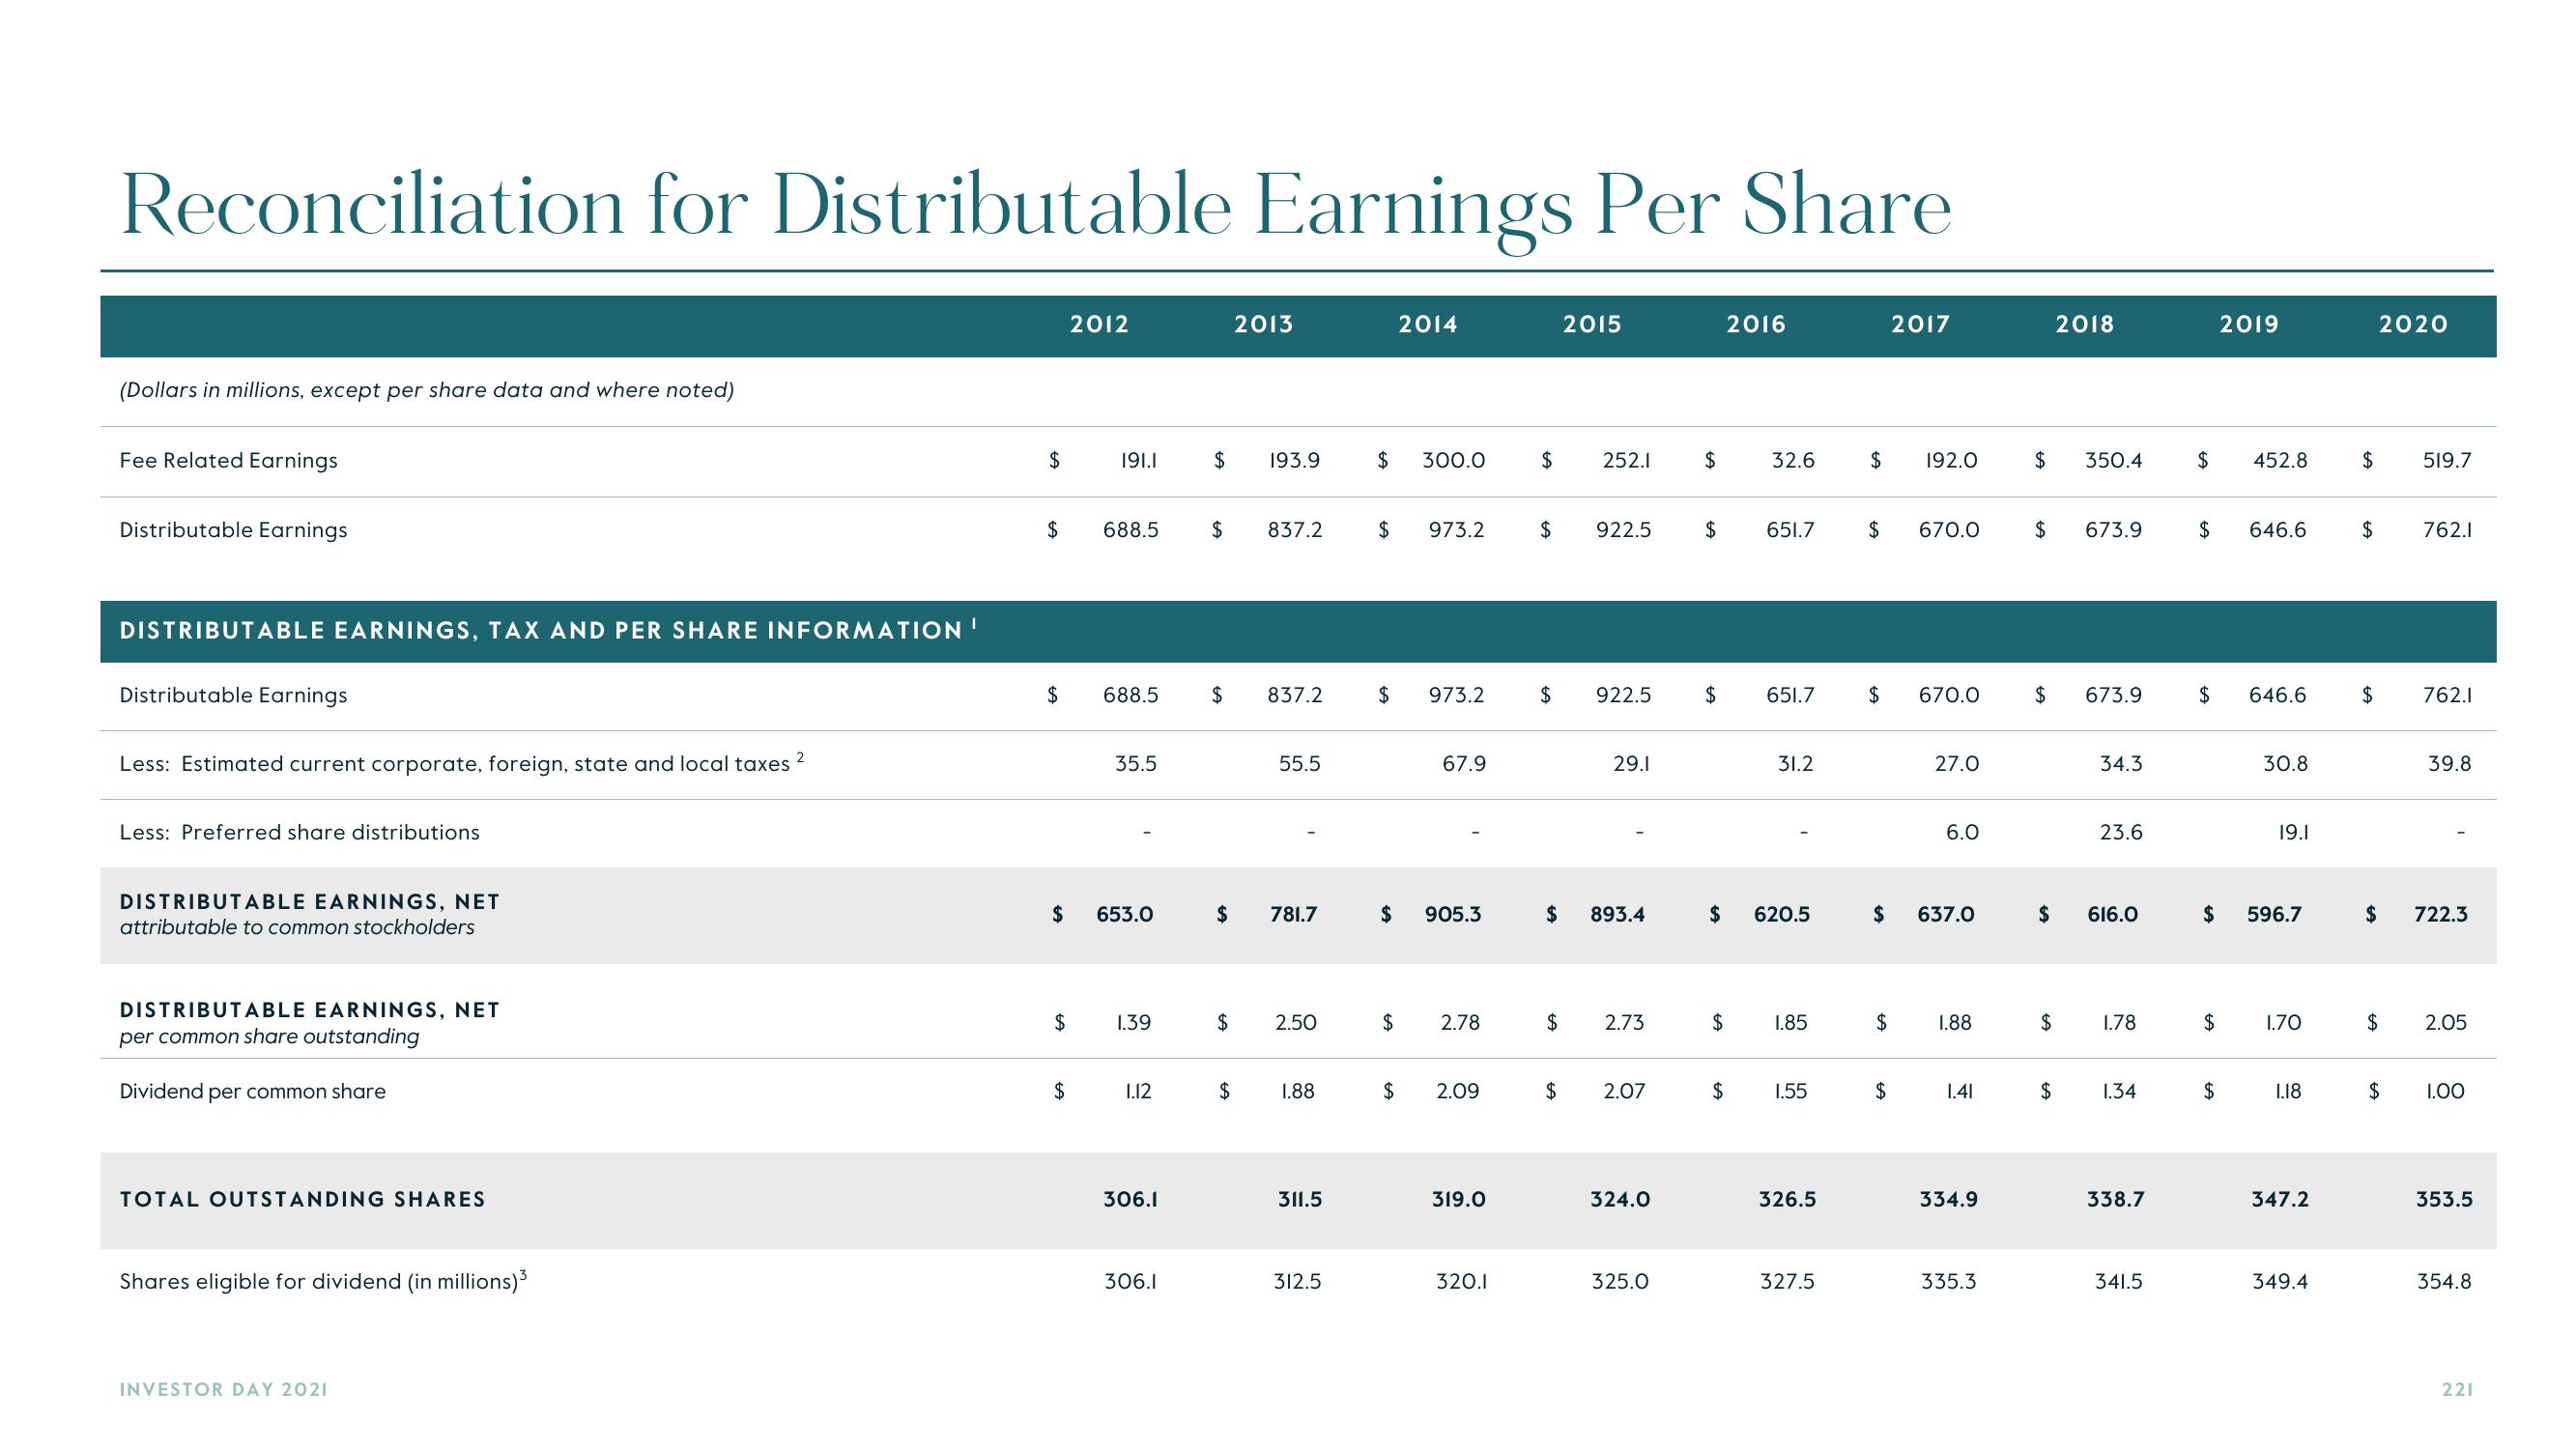
Reconciliation for Distributable Earnings Per Share
(Dollars in millions, except per share data and where noted)
Fee Related Earnings
Distributable Earnings
DISTRIBUTABLE EARNINGS, TAX AND PER SHARE INFORMATION!
Distributable Earnings
Less: Estimated current corporate, foreign, state and local taxes ²
Less: Preferred share distributions
DISTRIBUTABLE EARNINGS, NET
attributable to common stockholders
DISTRIBUTABLE EARNINGS, NET
per common share outstanding
Dividend per common share
TOTAL OUTSTANDING SHARES
Shares eligible for dividend (in millions) ³
INVESTOR DAY 2021
$
$
$
2012
$
191.1
688.5
35.5
$ 653.0
688.5 $ 837.2
1.39
1.12
306.1
$
306.1
$
2013
$
193.9
$
837.2
$ 781.7
55.5
2.50
1.88
311.5
312.5
$ 300.0
2014
$ 973.2
$ 973.2
$
$ 905.3
$
67.9
2.78
2.09
319.0
320.1
$ 252.1 $
$
$
2015
$ 922.5
$
$
922.5
29.1
893.4
2.73
2.07
324.0
325.0
$
$
$
2016
$
32.6
651.7
651.7
$ 620.5
31.2
1.85
1.55
326.5
327.5
$
$
$
$
2017
$ 670.0
$
192.0
670.0
27.0
6.0
637.0
1.88
1.41
334.9
335.3
$ 350.4
$ 673.9
2018
$ 673.9
$
$
$
34.3
23.6
616.0
1.78
1.34
338.7
341.5
$ 452.8
$
$
$
$
2019
$
646.6
646.6
30.8
19.1
596.7
1.70
1.18
347.2
349.4
$
$
$
$
2020
$
$
519.7
762.1
762.1
39.8
722.3
2.05
1.00
353.5
354.8
221View entire presentation