Vivid Seats Results Presentation Deck
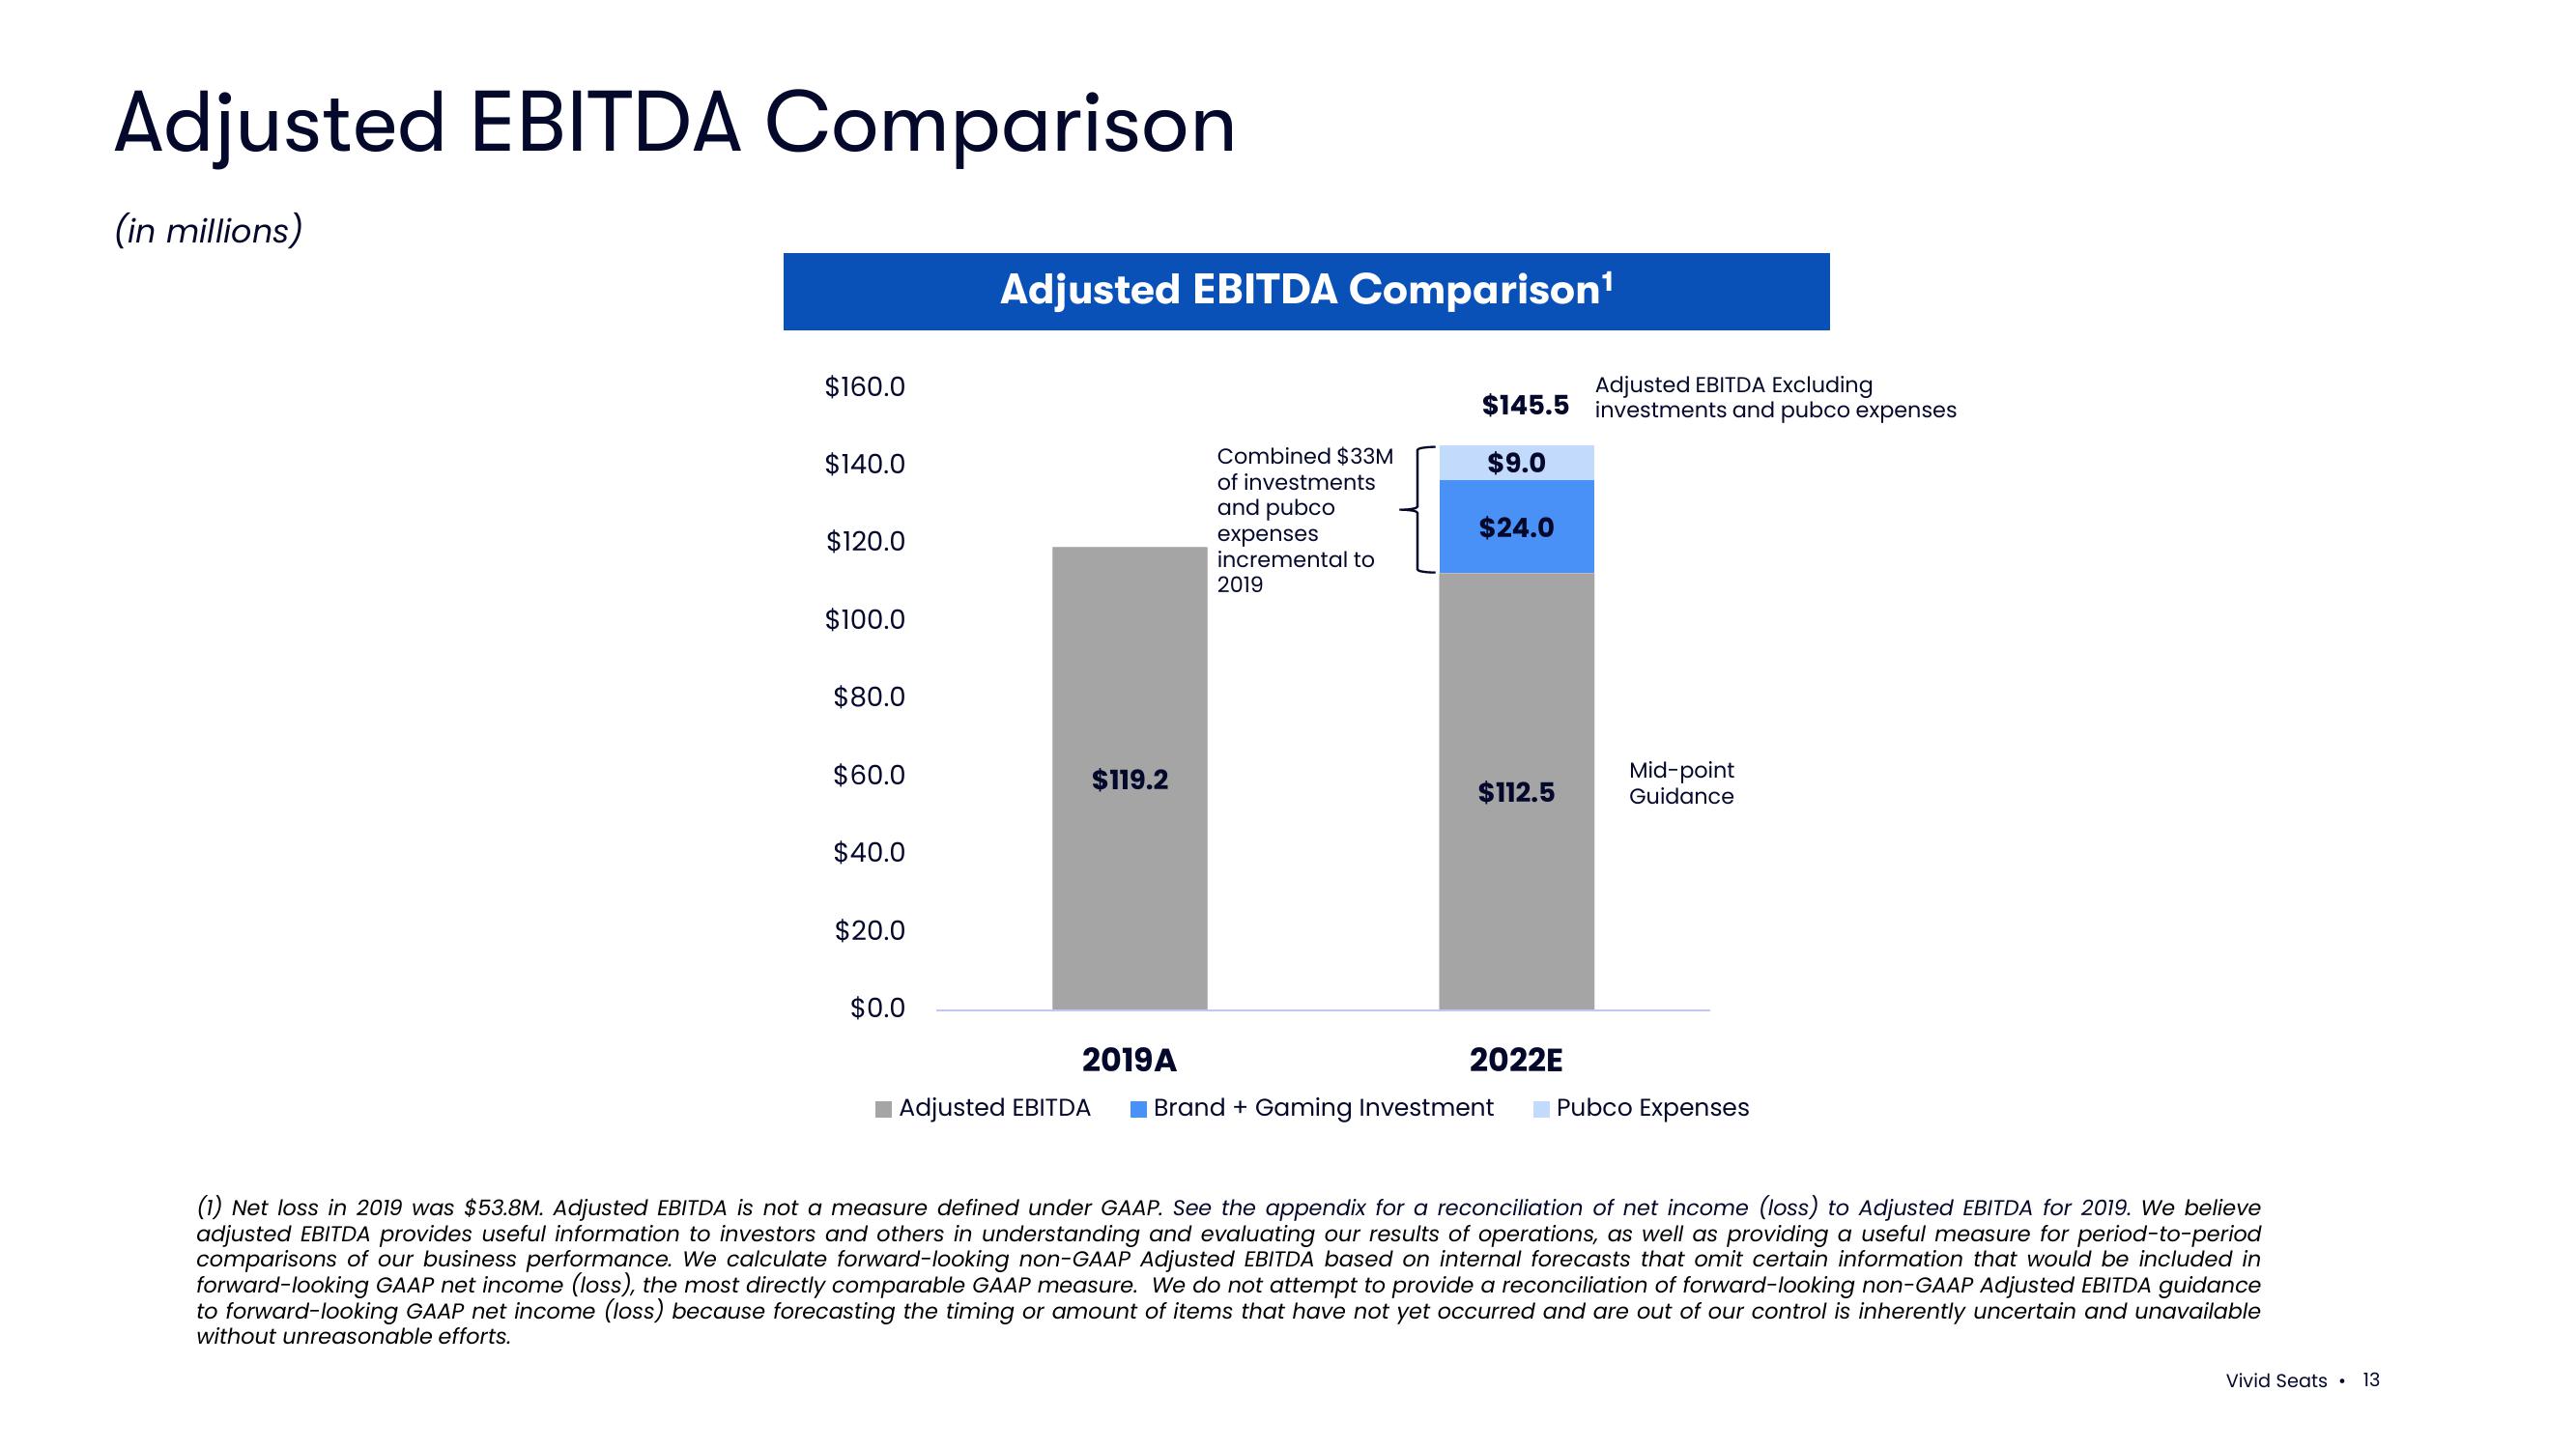
Adjusted EBITDA Comparison
(in millions)
$160.0
$140.0
$120.0
$100.0
$80.0
$60.0
$40.0
$20.0
$0.0
Adjusted EBITDA Comparison¹
$119.2
2019A
Combined $33M
of investments
and pubco
expenses
incremental to
2019
Adjusted EBITDA Excluding
$145.5 investments and pubco expenses
$9.0
$24.0
$112.5
2022E
Adjusted EBITDA Brand + Gaming Investment
Mid-point
Guidance
Pubco Expenses
(1) Net loss in 2019 was $53.8M. Adjusted EBITDA is not a measure defined under GAAP. See the appendix for a reconciliation of net income (loss) to Adjusted EBITDA for 2019. We believe
adjusted EBITDA provides useful information to investors and others in understanding and evaluating our results of operations, as well as providing a useful measure for period-to-period
comparisons of our business performance. We calculate forward-looking non-GAAP Adjusted EBITDA based on internal forecasts that omit certain information that would be included in
forward-looking GAAP net income (loss), the most directly comparable GAAP measure. We do not attempt to provide a reconciliation of forward-looking non-GAAP Adjusted EBITDA guidance
to forward-looking GAAP net income (loss) because forecasting the timing or amount of items that have not yet occurred and are out of our control is inherently uncertain and unavailable
without unreasonable efforts.
Vivid Seats. 13View entire presentation