Liberty Global Results Presentation Deck
VMO2 JV RECONCILIATIONS - ADJ EBITDA LESS P&E
ADDITIONS
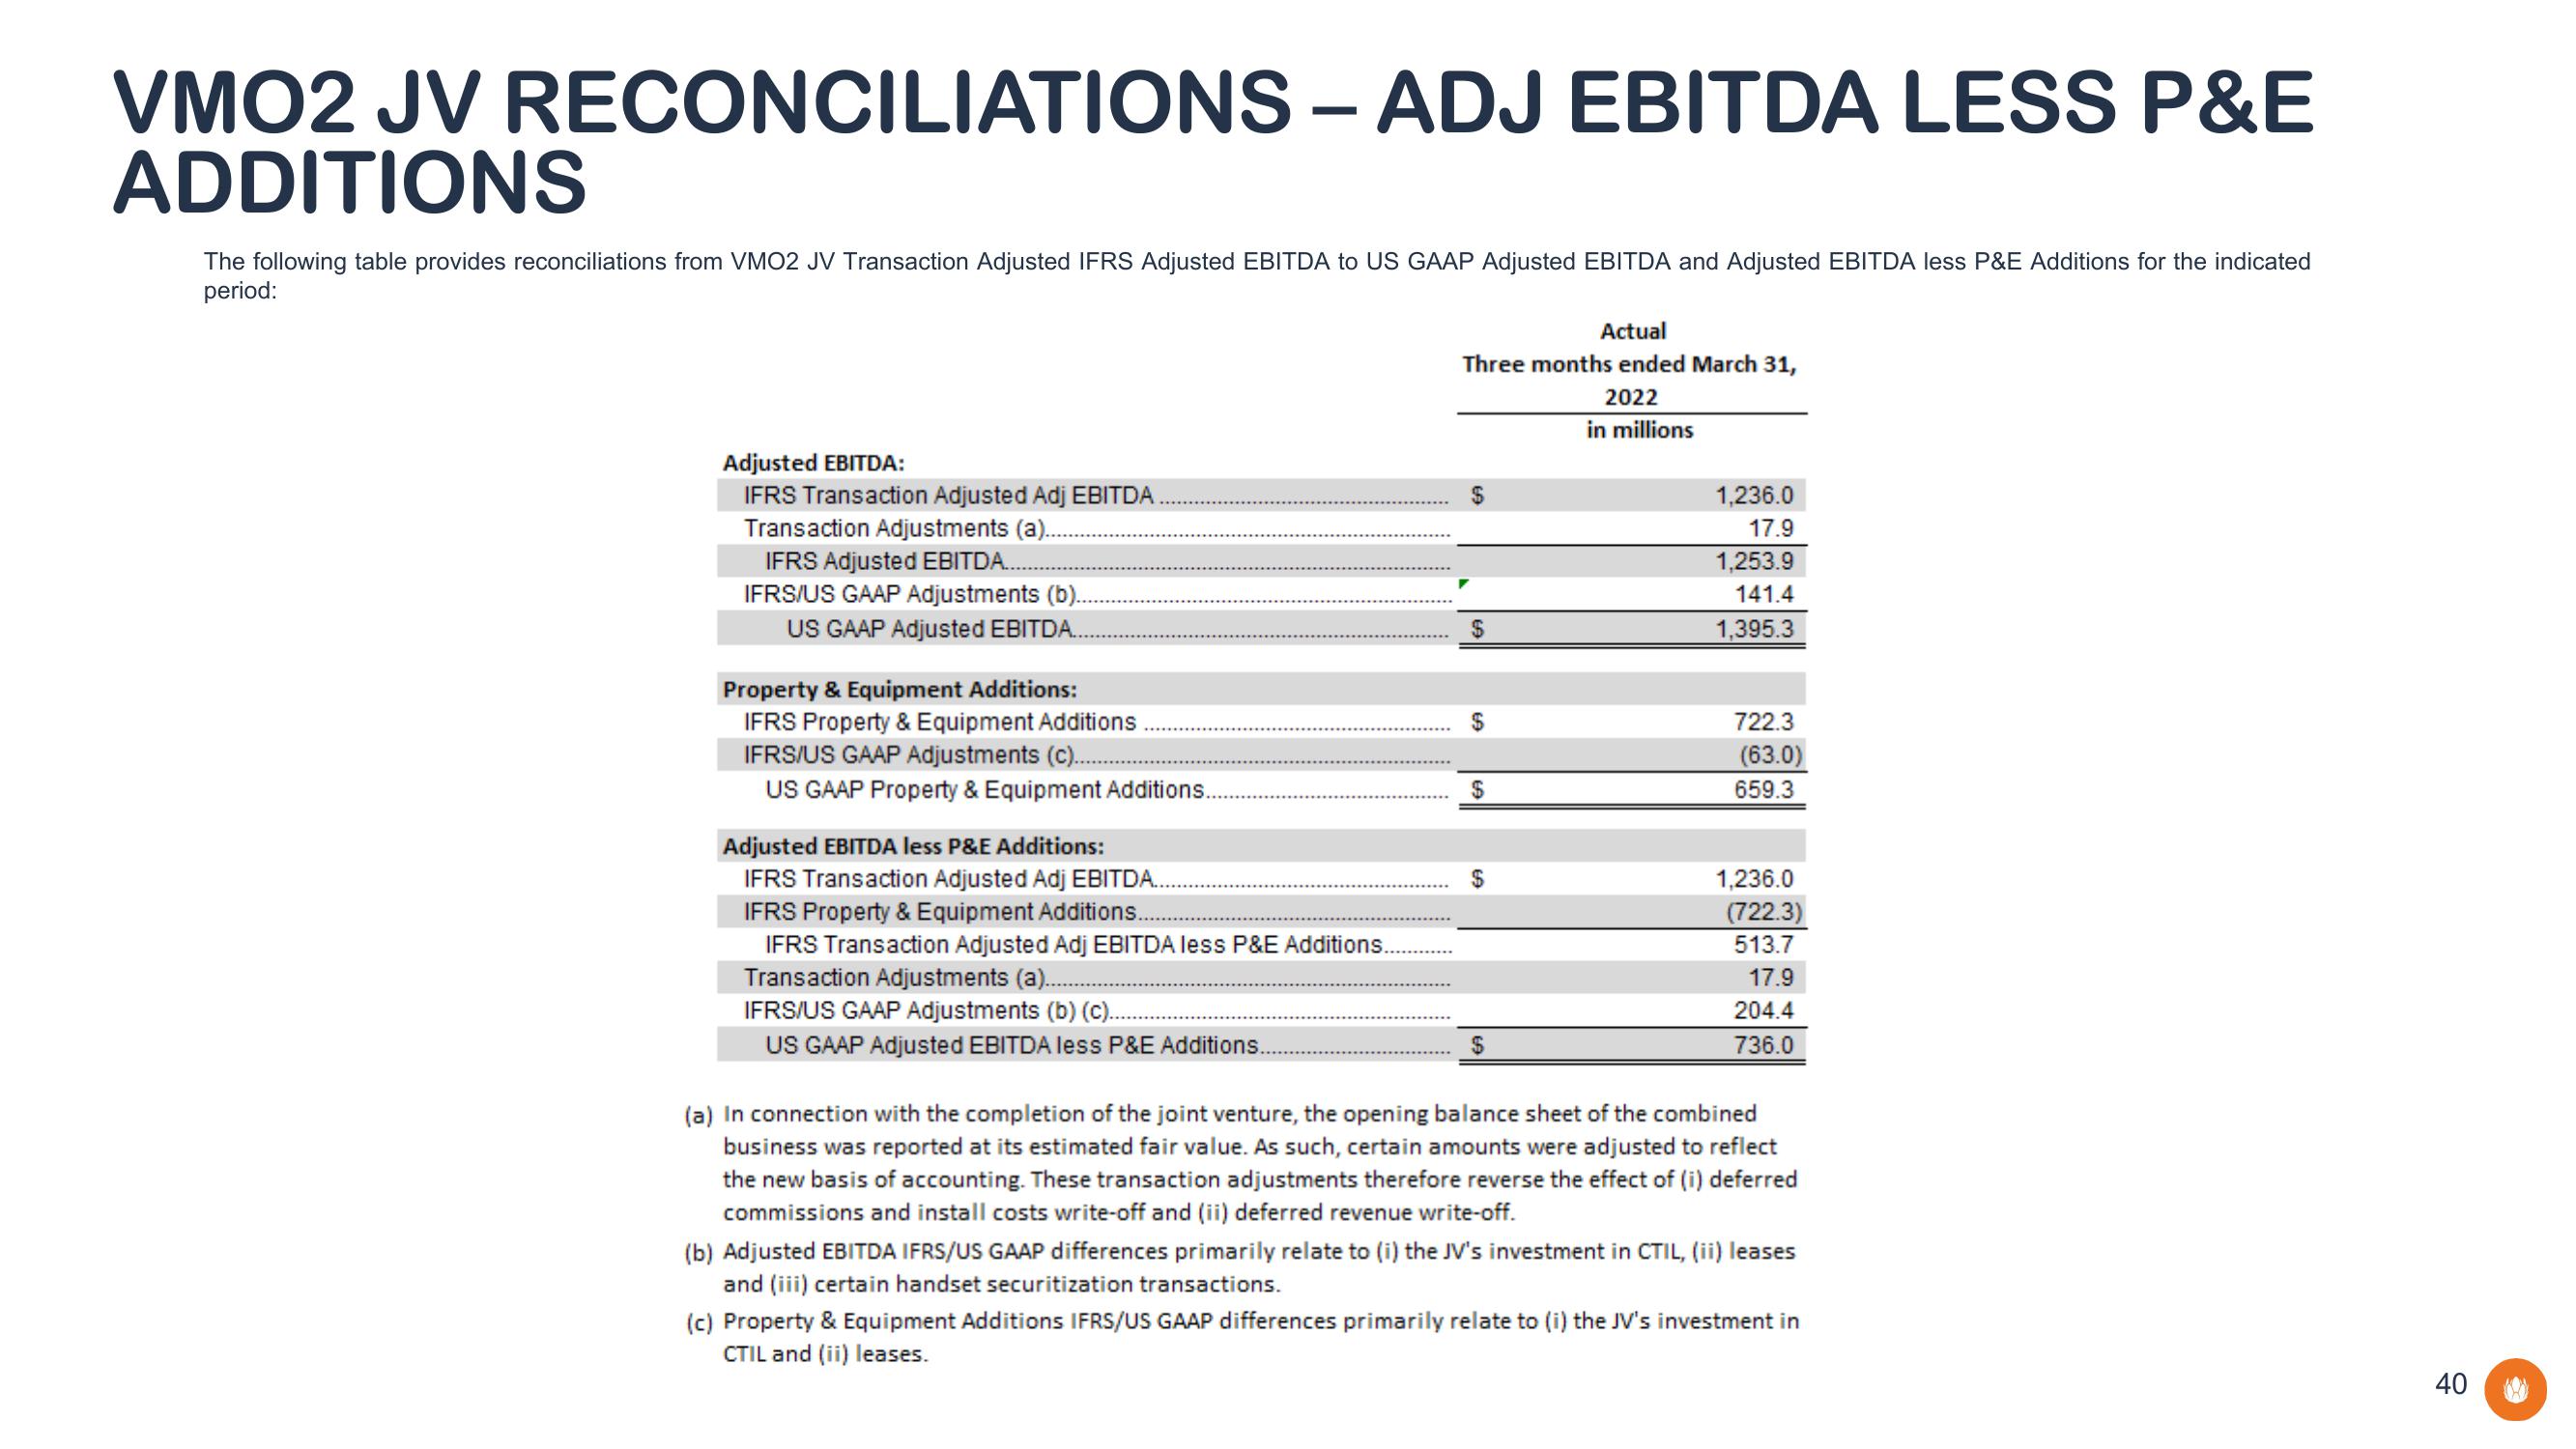
The following table provides reconciliations from VMO2 JV Transaction Adjusted IFRS Adjusted EBITDA to US GAAP Adjusted EBITDA and Adjusted EBITDA less P&E Additions for the indicated
period:
Adjusted EBITDA:
IFRS Transaction Adjusted Adj EBITDA
Transaction Adjustments (a).
IFRS Adjusted EBITDA...
IFRS/US GAAP Adjustments (b).
US GAAP Adjusted EBITDA..
Property & Equipment Additions:
IFRS Property & Equipment Additions
IFRS/US GAAP Adjustments (c)..
US GAAP Property & Equipment Additions..
Adjusted EBITDA less P&E Additions:
IFRS Transaction Adjusted Adj EBITDA..
IFRS Property & Equipment Additions..
IFRS Transaction Adjusted Adj EBITDA less P&E Additions...
Transaction Adjustments (a)...
IFRS/US GAAP Adjustments (b) (c)..
US GAAP Adjusted EBITDA less P&E Additions..
Actual
Three months ended March 31,
2022
in millions
$
$
$
$
1,236.0
17.9
1,253.9
141.4
1,395.3
722.3
(63.0)
659.3
1,236.0
(722.3)
513.7
17.9
204.4
736.0
(a) In connection with the completion of the joint venture, the opening balance sheet of the combined
business was reported at its estimated fair value. As such, certain amounts were adjusted to reflect
the new basis of accounting. These transaction adjustments therefore reverse the effect of (i) deferred
commissions and install costs write-off and (ii) deferred revenue write-off.
(b) Adjusted EBITDA IFRS/US GAAP differences primarily relate to (i) the JV's investment in CTIL, (ii) leases
and (iii) certain handset securitization transactions.
(c) Property & Equipment Additions IFRS/US GAAP differences primarily relate to (i) the JV's investment in
CTIL and (ii) leases.
40View entire presentation