Bank of America Investment Banking Pitch Book
SIRE Take Private Analysis
Premiums Paid in Selected Precedent MLP Take Privates
14
1
2
3
4
5
6
7
8
9
10
11
12
13
14
15
16
17
18
19
20
21
22
23
24
25
26
27
28
29
30
31
32
33
34
35
36
37
38
39
40
41
42
43
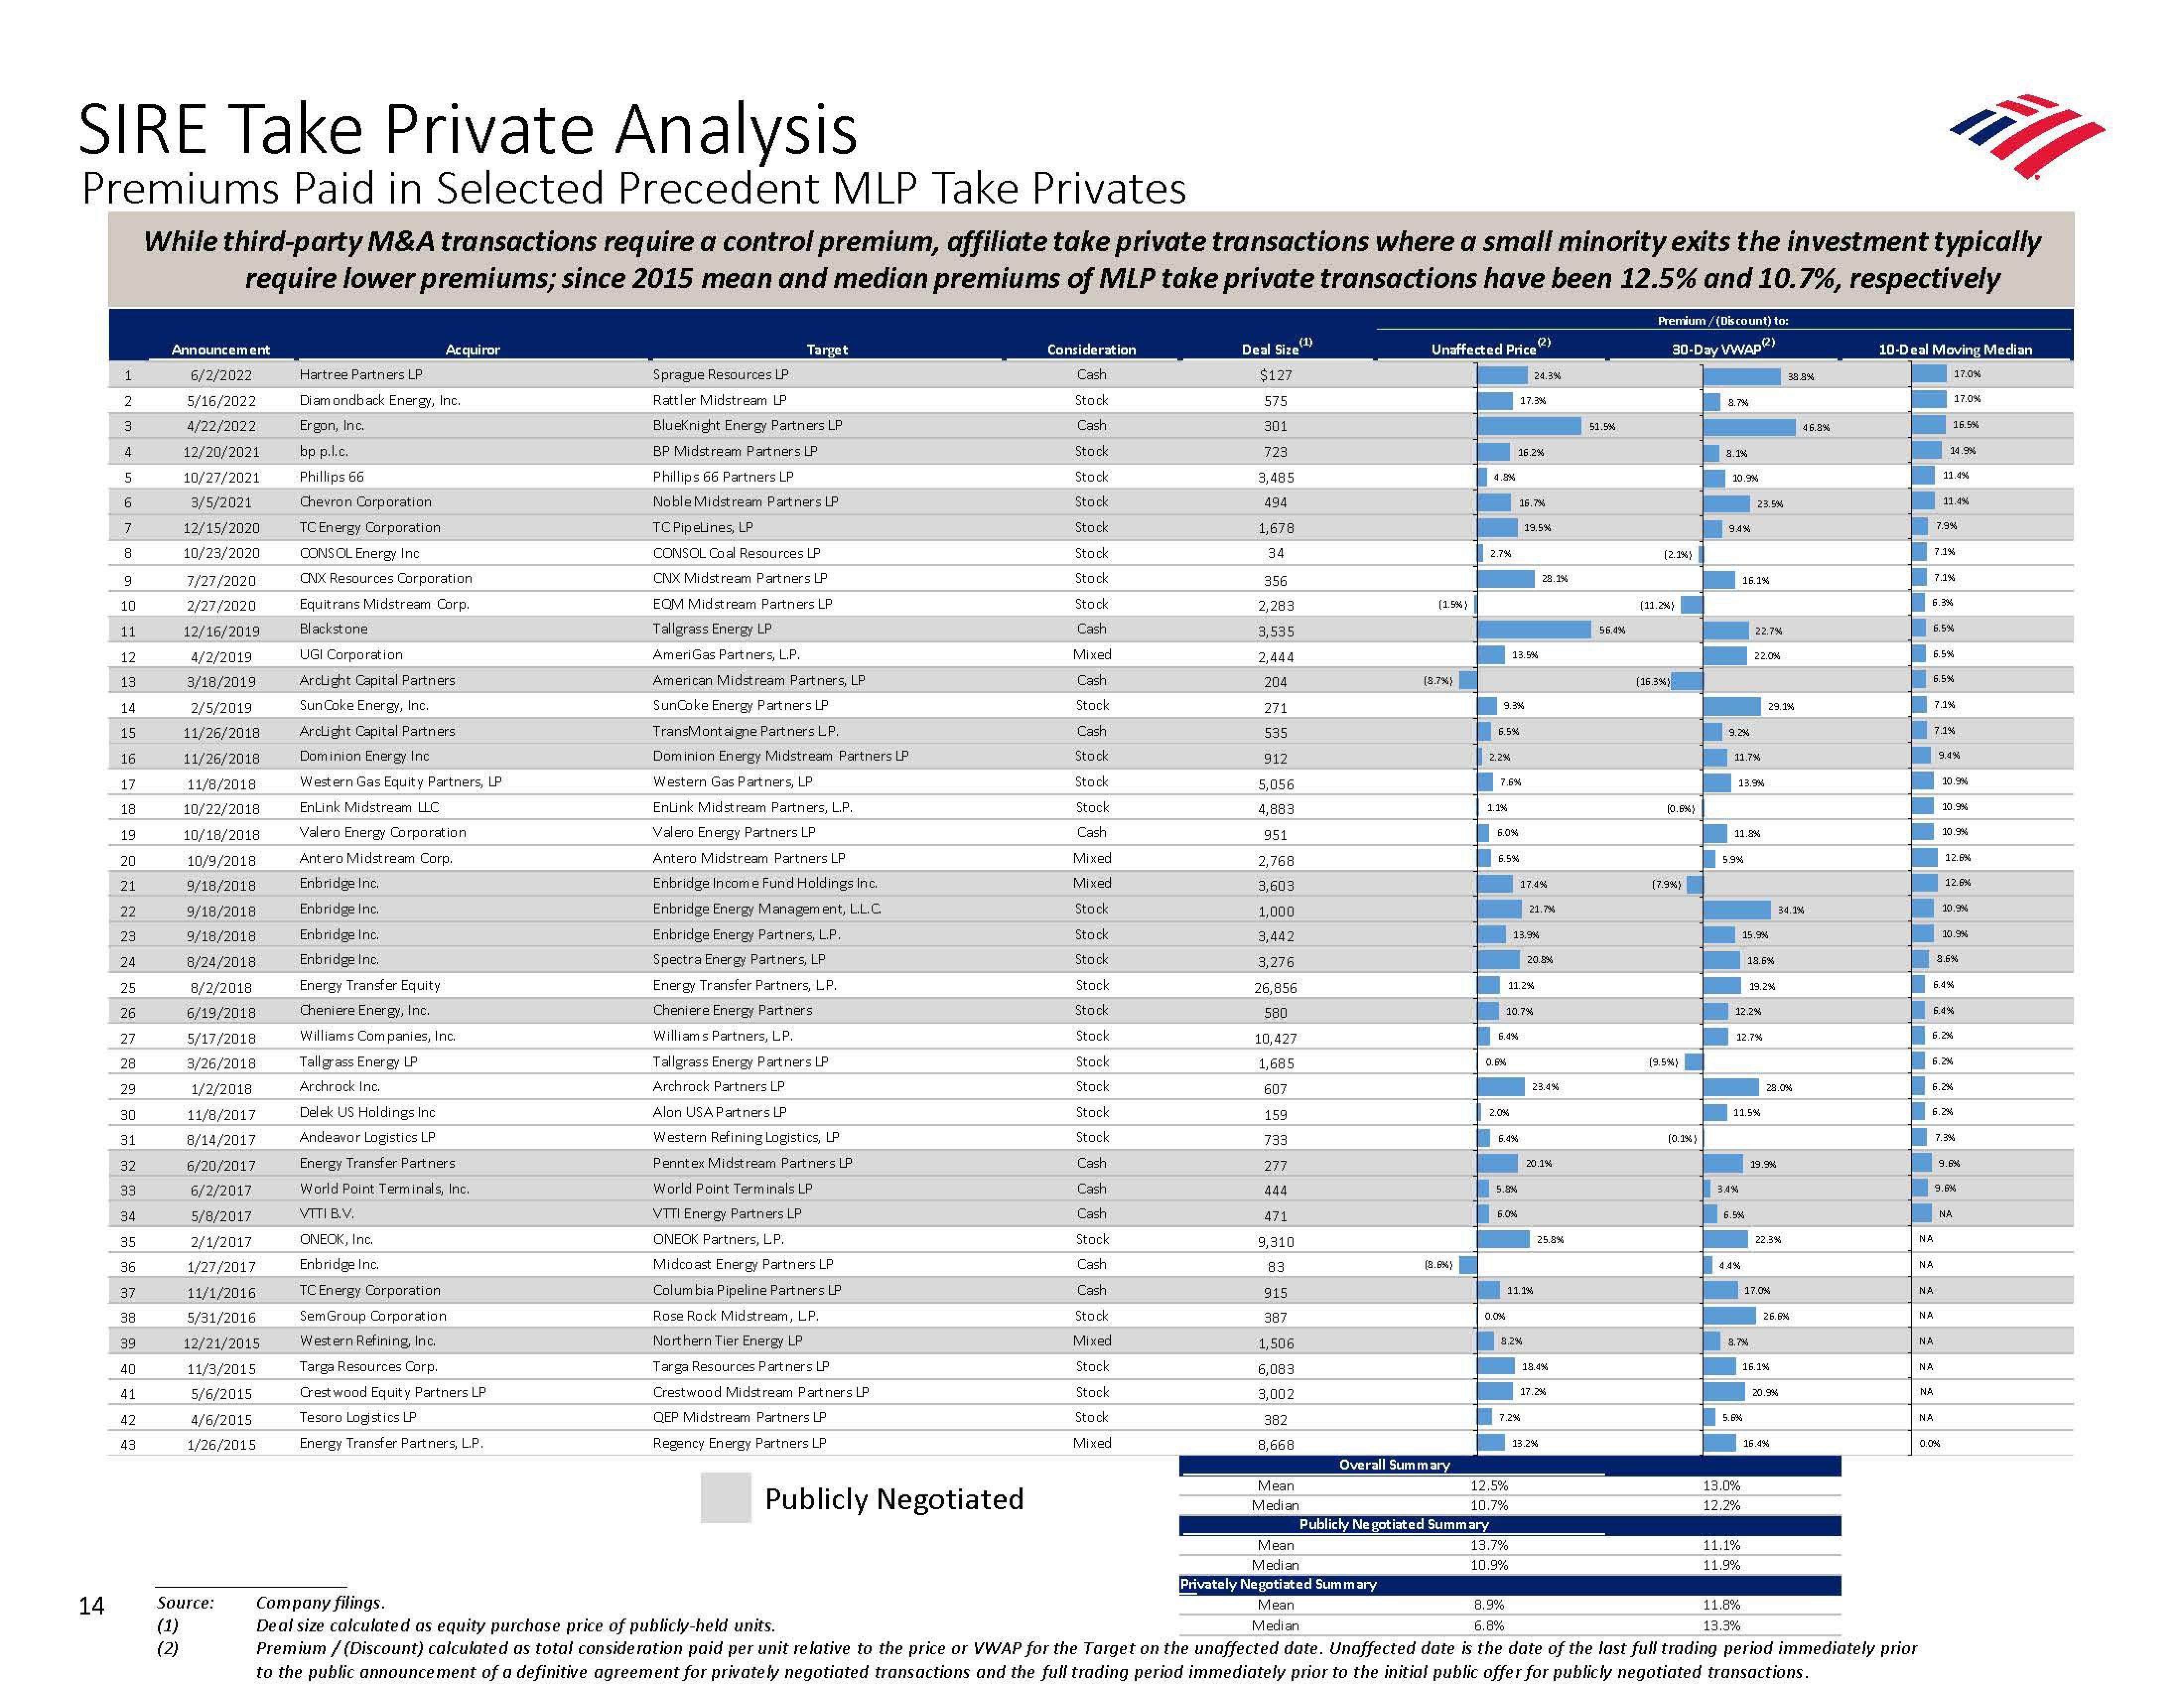
While third-party M&A transactions require a control premium, affiliate take private transactions where a small minority exits the investment typically
require lower premiums; since 2015 mean and median premiums of MLP take private transactions have been 12.5% and 10.7%, respectively
Announcement
6/2/2022
5/16/2022
4/22/2022
12/20/2021
10/27/2021
3/5/2021
12/15/2020
10/23/2020
7/27/2020
2/27/2020
12/16/2019
4/2/2019
3/18/2019
2/5/2019
11/26/2018
11/26/2018
11/8/2018
10/22/2018
10/18/2018
10/9/2018
9/18/2018
9/18/2018
9/18/2018
8/24/2018
8/2/2018
6/19/2018
5/17/2018
3/26/2018
1/2/2018
11/8/2017
8/14/2017
6/20/2017
6/2/2017
5/8/2017
2/1/2017
1/27/2017
11/1/2016
5/31/2016
12/21/2015
11/3/2015
5/6/2015
4/6/2015
1/26/2015
Source:
(1)
(2)
Hartree Partners LP
Diamondback Energy, Inc.
Ergon, Inc.
bp p.l.c.
Phillips 66
Chevron Corporation
TC Energy Corporation
CONSOL Energy Inc
CNX Resources Corporation
Equitrans Midstream Corp.
Blackstone
Acquiror
UGI Corporation
ArcLight Capital Partners
Sun Coke Energy, Inc.
ArcLight Capital Partners
Dominion Energy Inc
Western Gas Equity Partners, LP
EnLink Midstream LLC
Valero Energy Corporation
Antero Midstream Corp.
Enbridge Inc.
Enbridge Inc.
Enbridge Inc.
Enbridge Inc.
Energy Transfer Equity
Cheniere Energy, Inc.
Williams Companies, Inc.
Tallgrass Energy LP
Archrock Inc.
Delek US Holdings Inc
Andeavor Logistics LP
Energy Transfer Partners
World Point Terminals, Inc.
VTTI B.V.
ONEOK, Inc.
Enbridge Inc.
TC Energy Corporation
Sem Group Corporation
Western Refining, Inc.
Targa Resources Corp.
Crest wood Equity Partners LP
Tesoro Logistics LP
Energy Transfer Partners, L.P.
Target
Sprague Resources LP
Rattler Midstream LP
BlueKnight Energy Partners LP
BP Midstream Partners LP
Phillips 66 Partners LP
Noble Midstream Partners LP
TC Pipelines, LP
CONSOL Coal Resources LP
CNX Midstream Partners LP
EQM Midstream Partners LP
Tallgrass Energy LP
AmeriGas Partners, L.P.
American Midstream Partners, LP
SunCoke Energy Partners LP
TransMontaigne Partners LP.
Dominion Energy Midstream Partners LP
Western Gas Partners, LP
EnLink Midstream Partners, L.P.
Valero Energy Partners LP
Antero Midstream Partners LP
Enbridge Income Fund Holdings Inc.
Enbridge Energy Management, L.L.C
Enbridge Energy Partners, L.P.
Spectra Energy Partners, LP
Energy Transfer Partners, LP.
Cheniere Energy Partners
Williams Partners, LP.
Tallgrass Energy Partners LP
Archrock Partners LP
Alon USA Partners LP
Western Refining Logistics, LP
Pennt ex Midstream Partners LP
World Point Terminals LP
VTTI Energy Partners LP
ONEOK Partners, LP.
Midcoast Energy Partners LP
Columbia Pipeline Partners LP
Rose Rock Midstream, LP.
Northern Tier Energy LP
Targa Resources Partners LP
Crestwood Midstream Partners LP
QEP Midstream Partners LP
Regency Energy Partners LP
Publicly Negotiated
Consideration
Cash
Stock
Cash
Stock
Stock
Stock
Stock
Stock
Stock
Stock
Cash
Mixed
Cash
Stock
Cash
Stock
Stock
Stock
Cash
Mixed
Mixed
Stock
Stock
Stock
Stock
Stock
Stock
Stock
Stock
Stock
Stock
Cash
Cash
Cash
Stock
Cash
Cash
Stock
Mixed
Stock
Stock
Stock
Mixed
Deal Size (1)
$127
575
301
723
3,485
494
1,678
34
356
2,283
3,535
2,444
204
271
535
912
5,056
4,883
951
2,768
3,603
1,000
3,442
3,276
26,856
580
10,427
1,685
607
159
733
277
444
471
9,310
83
915
387
1,506
6,083
3,002
382
8,668
Mean
Median
Unaffected Price (2)
(1.5%)
Mean
Median
Privately Negotiated Summary
Mean
Median
(8.7%)
(8.6%)
Overall Summary
4.8%
2.7%
2.2%
6.5%
1.1%
9.3%
7.6%
0.6%
6.0%
6.5%
2.0%
6.4%
16.2%
13.5%
0.0%
17.3%
6.4%
5.8%
16.7%
6.0%
Publicly Negotiated Summary
13.7%
10.9%
11.2%
10.7%
12.5%
10.7%
13.9%
24.3%
19.5%
17.4%
8.2%
7,2%
21.7%
20.8%
11.1%
28.1%
23.4%
20.1%
25.8%
18.4%
17.2%
13.2 %
51.5%
56.4%
Premium/(Discount) to:
30-Day VWAPⓇ)
(2.1%)
(11.2%)
(16.3%)
(0.6%)
(7.9%)
(9.5%)
(0.2%)
8.7%
8.1%
10.9%
9.4%
5.9%
11.7%
13.9%
16.1%
11.8%
3.4%
23.5%
6.5%
22.7%
12.2%
13.0%
12.2%
22.0%
15.9%
12,7%
11.1%
11.9%
11.5%
8.7%
5.6%
11.8%
13.3%
18.6%
19.2%
29.1%
19.9%
28.0%
17.0%
22.3%
16.1%
38.8%
34.1%
26.6%
20.9%
16.4%
46.3%
10-Deal Moving Median
17.0%
6.3%
NA
8.9%
Company filings.
6.8%
De al size calculated as equity purchase price of publicly-held units.
Premium / (Discount) calculated as total consideration paid per unit relative to the price or VWAP for the Target on the unaffected date. Unaffected date is the date of the last full trading period immediately prior
to the public announcement of a definitive agreement for privately negotiated transactions and the full trading period immediately prior to the initial public offer for publicly negotiated transactions.
NA
NA
16.5%
14.9%
6.5%
11.4%
7.1%
6.5%
6.5%
NA
11.4%
7.9%
7.1%
NA
NA
17.0%
NA
7.1%
7.1%
NA
9.4%
10.9%
6.4%
6.2%
10.9%
6.2%
10.9%
6.4%
12.6%
6.2%
6.2%
12.6%
0.0%
10.9%
10.9%
8.6%
7.3%
9.6%
9.6%
NAView entire presentation