HBT Financial Results Presentation Deck
Non-GAAP Reconciliations (cont'd)
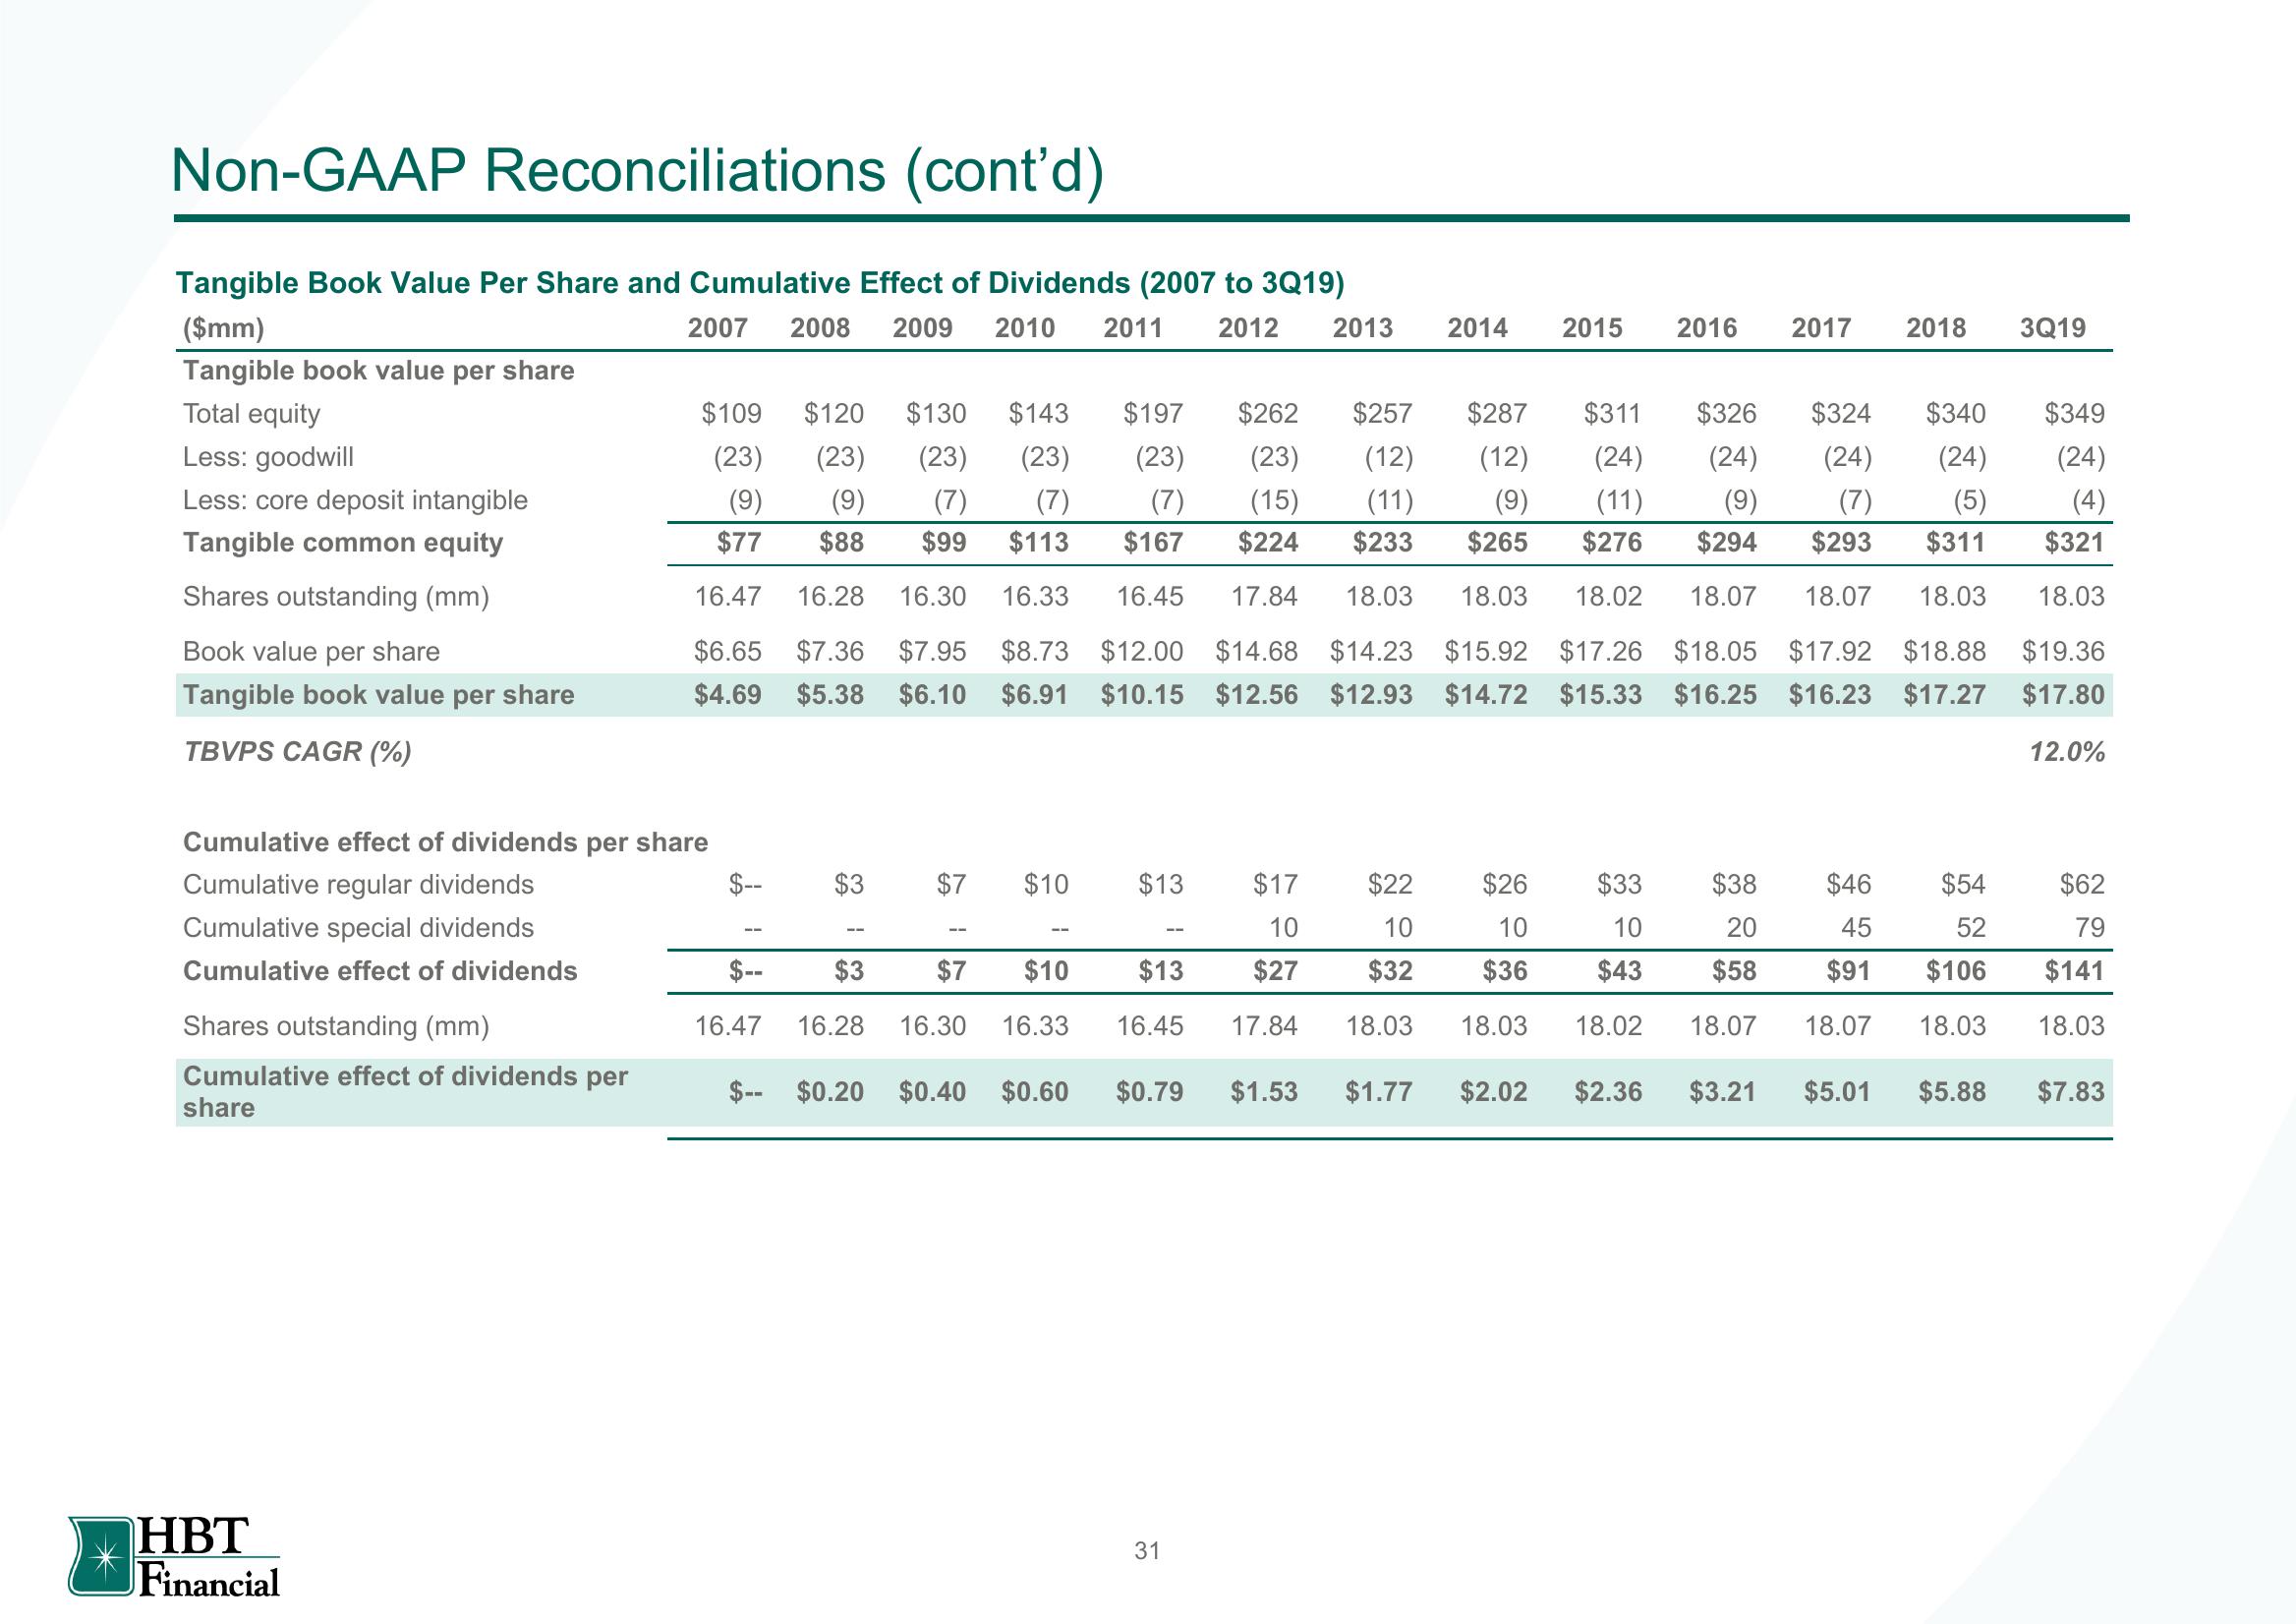
Tangible Book Value Per Share and Cumulative Effect of Dividends (2007 to 3Q19)
($mm)
2007 2008 2009 2010 2011 2012 2013
Tangible book value per share
Total equity
Less: goodwill
Less: core deposit intangible
Tangible common equity
Shares outstanding (mm)
Book value per share
Tangible book value per share
TBVPS CAGR (%)
Shares outstanding (mm)
Cumulative effect of dividends per
share
$109
(23)
(9)
$77
Cumulative effect of dividends per share
Cumulative regular dividends
Cumulative special dividends
Cumulative effect of dividends
HBT
Financial
$--
$120 $130 $143
(23) (23) (23)
(9) (7) (7)
$88 $99 $113
16.47
16.47 16.28 16.30 16.33
$6.65 $7.36 $7.95 $8.73 $12.00 $14.68 $14.23 $15.92 $17.26 $18.05 $17.92 $18.88
$4.69 $5.38 $6.10 $6.91 $10.15 $12.56 $12.93 $14.72 $15.33 $16.25 $16.23 $17.27
$3
$7 $10
$197 $262 $257 $287 $311 $326 $324
(23) (23) (12) (12) (24) (24) (24)
(7) (15) (11) (9) (11) (9) (7)
$167 $224 $233 $265 $276 $294 $293
16.45 17.84 18.03 18.03 18.02 18.07 18.07 18.03
$13
2014 2015 2016 2017 2018 3Q19
-=
$13
16.45
31
$17 $22 $26
10
10
10
$27 $32 $36
18.03 18.03
17.84
$340 $349
(24) (24)
(5)
(4)
$321
$311
18.03
$38 $46
$33
10
20
45
$58
$91
$43
18.02 18.07
18.07
$54
52
$106
18.03
$3 $7 $10
16.28 16.30 16.33
$0.20 $0.40 $0.60 $0.79 $1.53 $1.77 $2.02 $2.36 $3.21 $5.01 $5.88
$19.36
$17.80
12.0%
$62
79
$141
18.03
$7.83View entire presentation