Sema4 SPAC
29
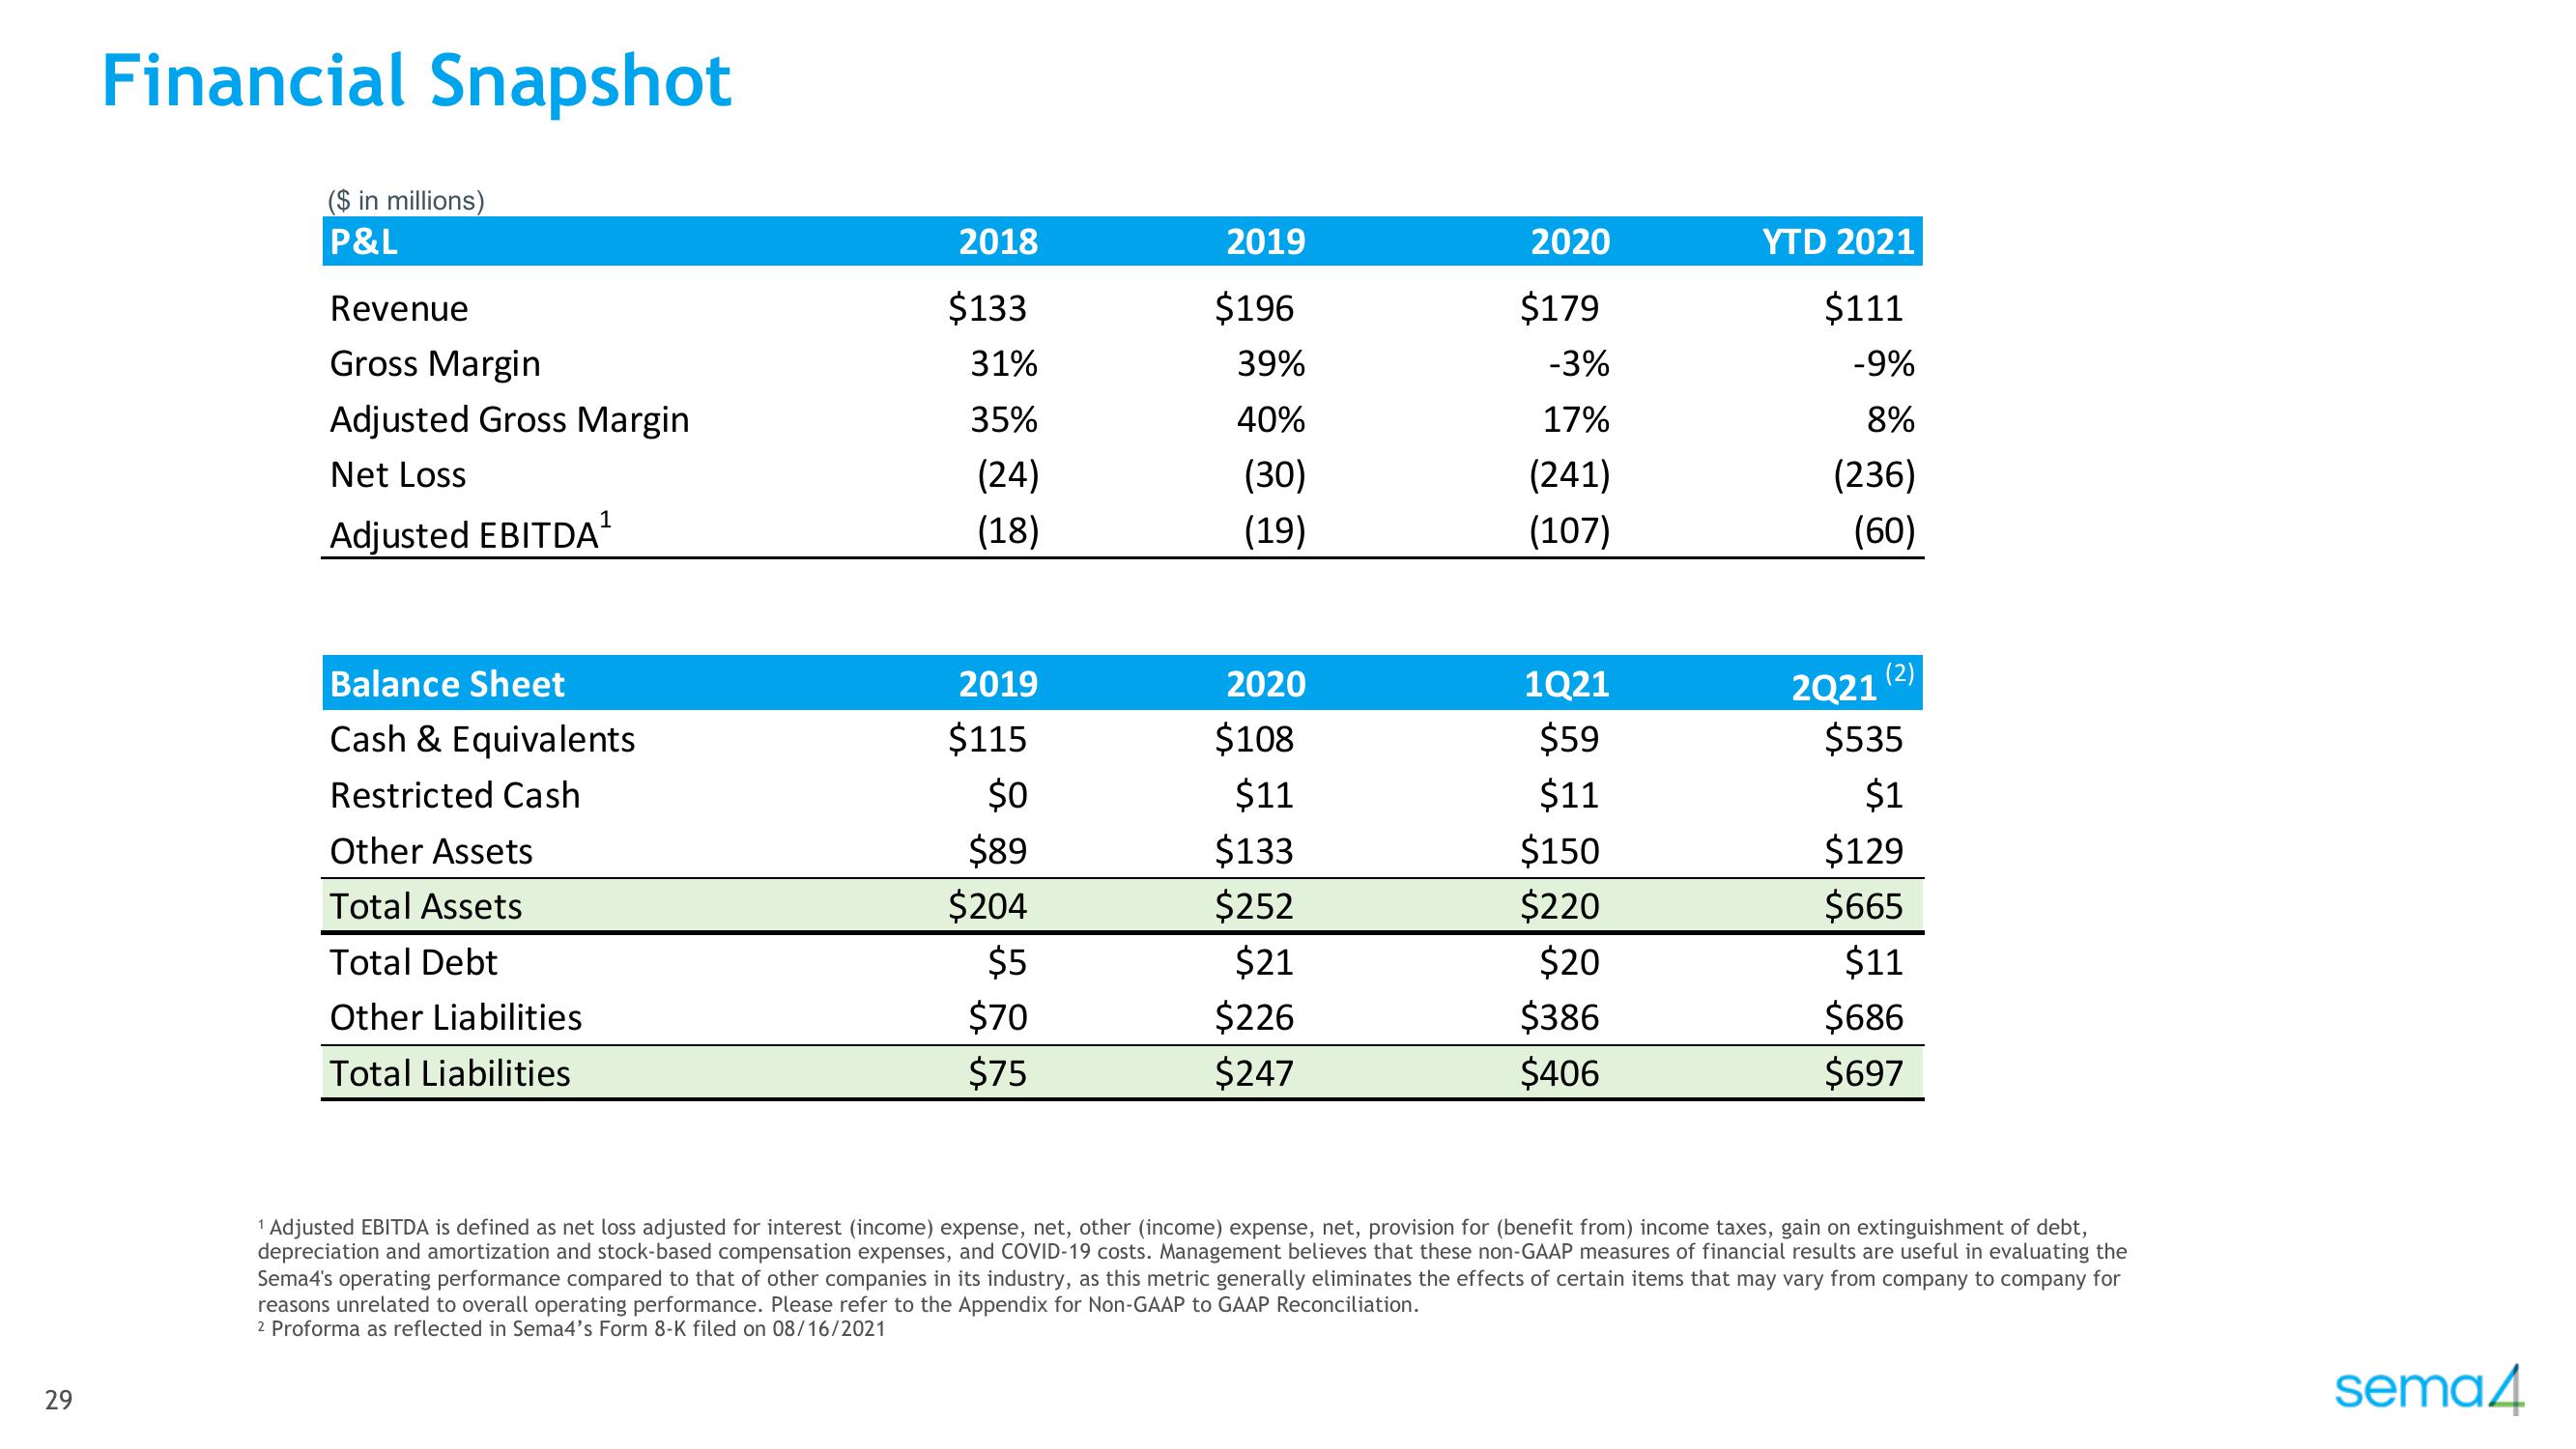
Financial Snapshot
($ in millions)
P&L
Revenue
Gross Margin
Adjusted Gross Margin
Net Loss
1
Adjusted EBITDA ¹
Balance Sheet
Cash & Equivalents
Restricted Cash
Other Assets
Total Assets
Total Debt
Other Liabilities
Total Liabilities
2018
$133
31%
35%
(24)
(18)
2019
$115
$0
$89
$204
$5
$70
$75
2019
$196
39%
40%
(30)
(19)
2020
$108
$11
$133
$252
$21
$226
$247
2020
$179
-3%
17%
(241)
(107)
1Q21
$59
$11
$150
$220
$20
$386
$406
YTD 2021
$111
-9%
8%
(236)
(60)
2Q21
(2)
$535
$1
$129
$665
$11
$686
$697
¹ Adjusted EBITDA is defined as net loss adjusted for interest (income) expense, net, other (income) expense, net, provision for (benefit from) income taxes, gain on extinguishment of debt,
depreciation and amortization and stock-based compensation expenses, and COVID-19 costs. Management believes that these non-GAAP measures of financial results are useful in evaluating the
Sema4's operating performance compared to that of other companies in its industry, as this metric generally eliminates the effects of certain items that may vary from company to company for
reasons unrelated to overall operating performance. Please refer to the Appendix for Non-GAAP to GAAP Reconciliation.
2 Proforma as reflected in Sema4's Form 8-K filed on 08/16/2021
sema4View entire presentation