Doximity Investor Presentation Deck slide image

Doximity Investor Presentation Deck

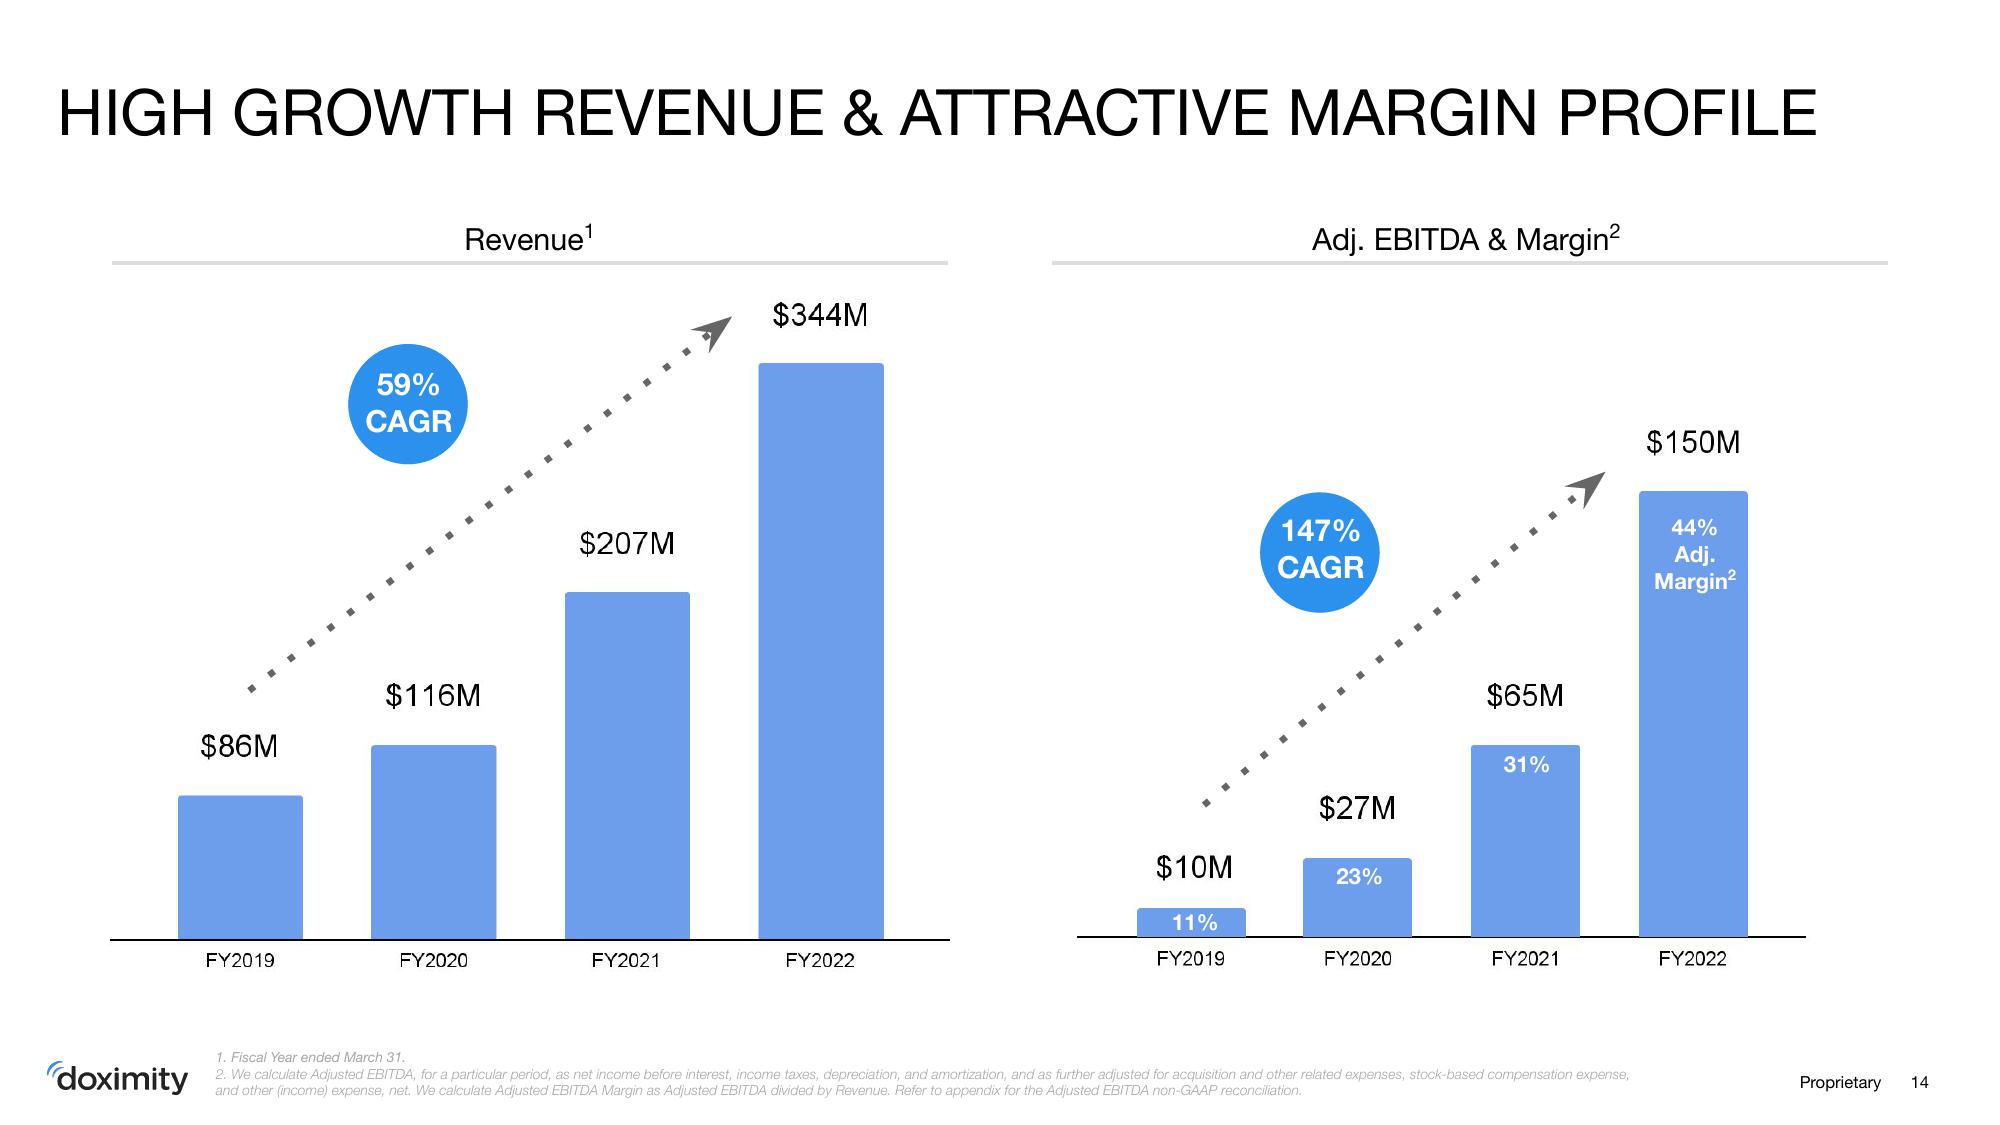
HIGH GROWTH REVENUE & ATTRACTIVE MARGIN PROFILE doximity $86M FY2019 59% CAGR Revenue¹ $116M FY2020 $207M FY2021 $344M FY2022 $10M 11% FY2019 Adj. EBITDA & Margin² 147% CAGR $27M 23% FY2020 $65M 31% FY2021 1. Fiscal Year ended March 31. 2. We calculate Adjusted EBITDA, for a particular period, as net income before interest, income taxes, depreciation, and amortization, and as further adjusted for acquisition and other related expenses, stock-based compensation expense, and other (income) expense, net. We calculate Adjusted EBITDA Margin as Adjusted EBITDA divided by Revenue. Refer to appendix for the Adjusted EBITDA non-GAAP reconciliation. $150M 44% Adj. Margin² FY2022 Proprietary 14
View entire presentation