Bridge Investment Group Results Presentation Deck
Appendix
($ in thousands)
Assets
Cash and cash equivalents
Restricted cash
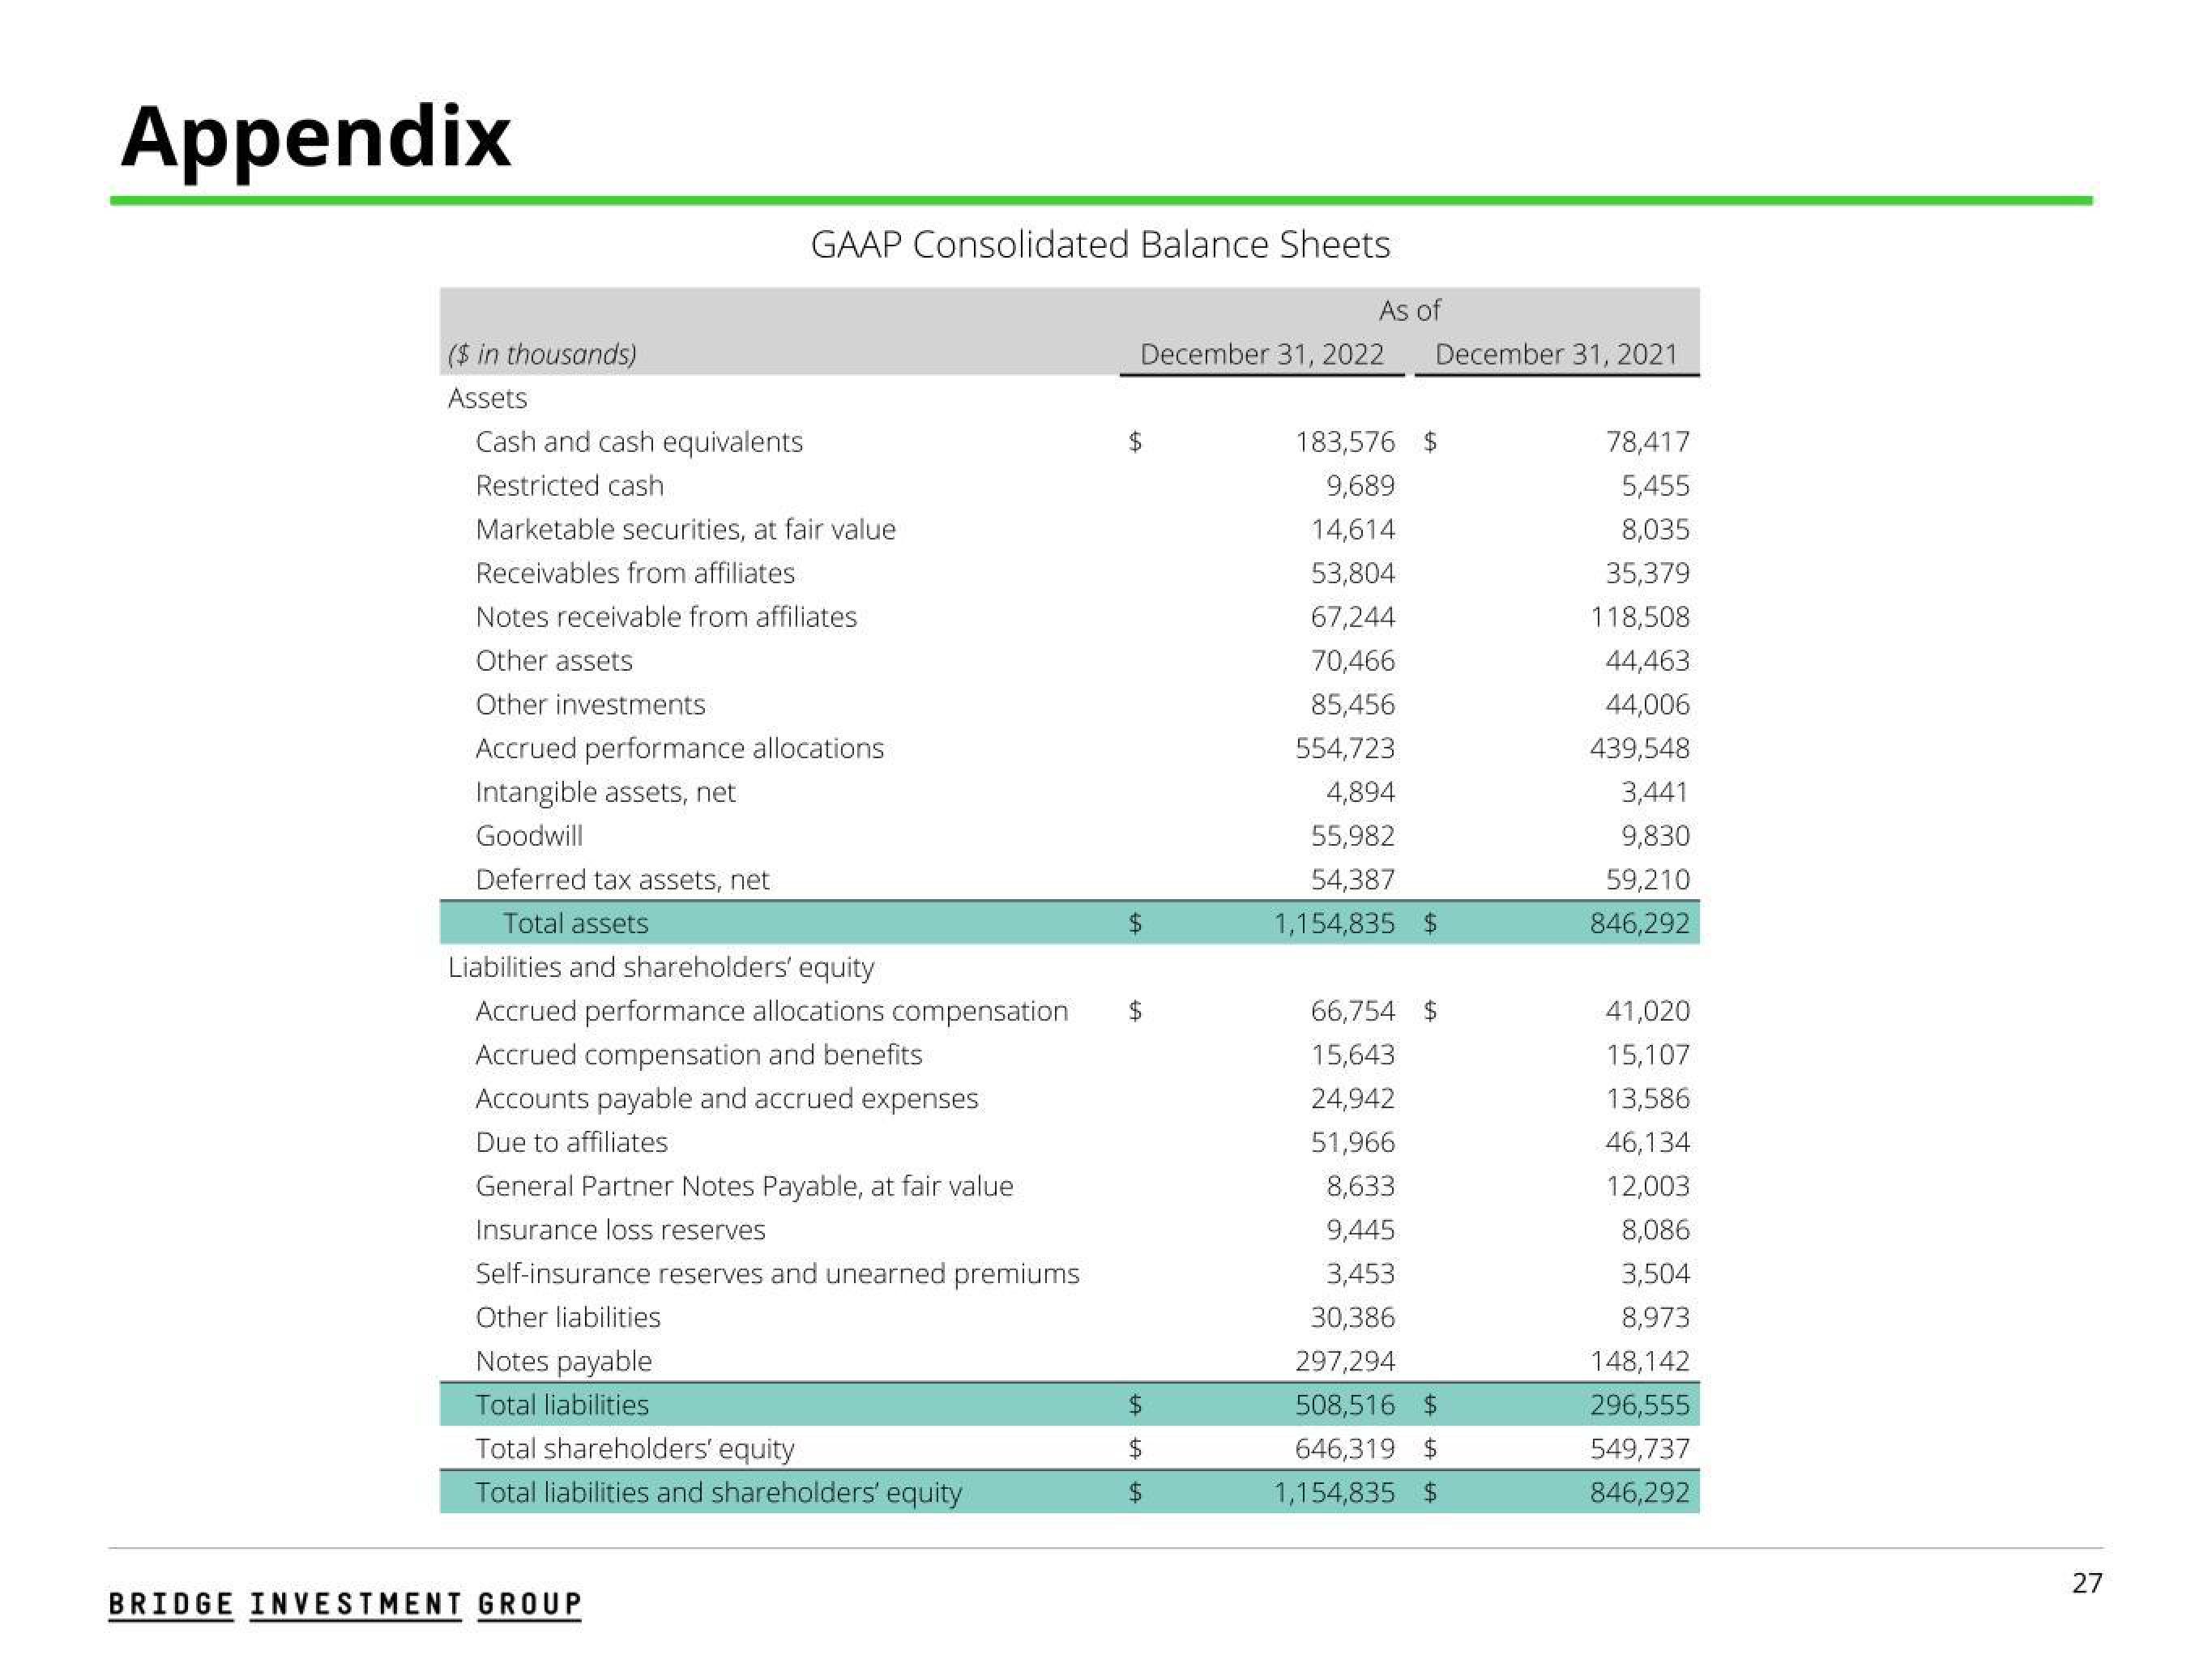
GAAP Consolidated Balance Sheets
Marketable securities, at fair value
Receivables from affiliates
Notes receivable from affiliates
Other assets
Other investments
Accrued performance allocations
Intangible assets, net
Goodwill
Deferred tax assets, net
Total assets
Liabilities and shareholders' equity
Accrued performance allocations compensation
Accrued compensation and benefits
Accounts payable and accrued expenses
Due to affiliates
General Partner Notes Payable, at fair value
Insurance loss reserves
Self-insurance reserves and unearned premiums
Other liabilities
Notes payable
Total liabilities
Total shareholders' equity
Total liabilities and shareholders' equity
BRIDGE INVESTMENT GROUP
As of
December 31, 2022 December 31, 2021
$
$
$
LA LA LA
$
$
183,576 $
9,689
14,614
53,804
67,244
70,466
85,456
554,723
4,894
55,982
54,387
1,154,835 $
66,754 $
15,643
24,942
51,966
8,633
9,445
3,453
30,386
297,294
508,516 $
646,319 $
1,154,835 $
78,417
5,455
8,035
35,379
118,508
44,463
44,006
439,548
3,441
9,830
59,210
846,292
41,020
15,107
13,586
46,134
12,003
8,086
3,504
8,973
148,142
296,555
549,737
846,292
27View entire presentation