Micro Focus Credit Presentation Deck
16
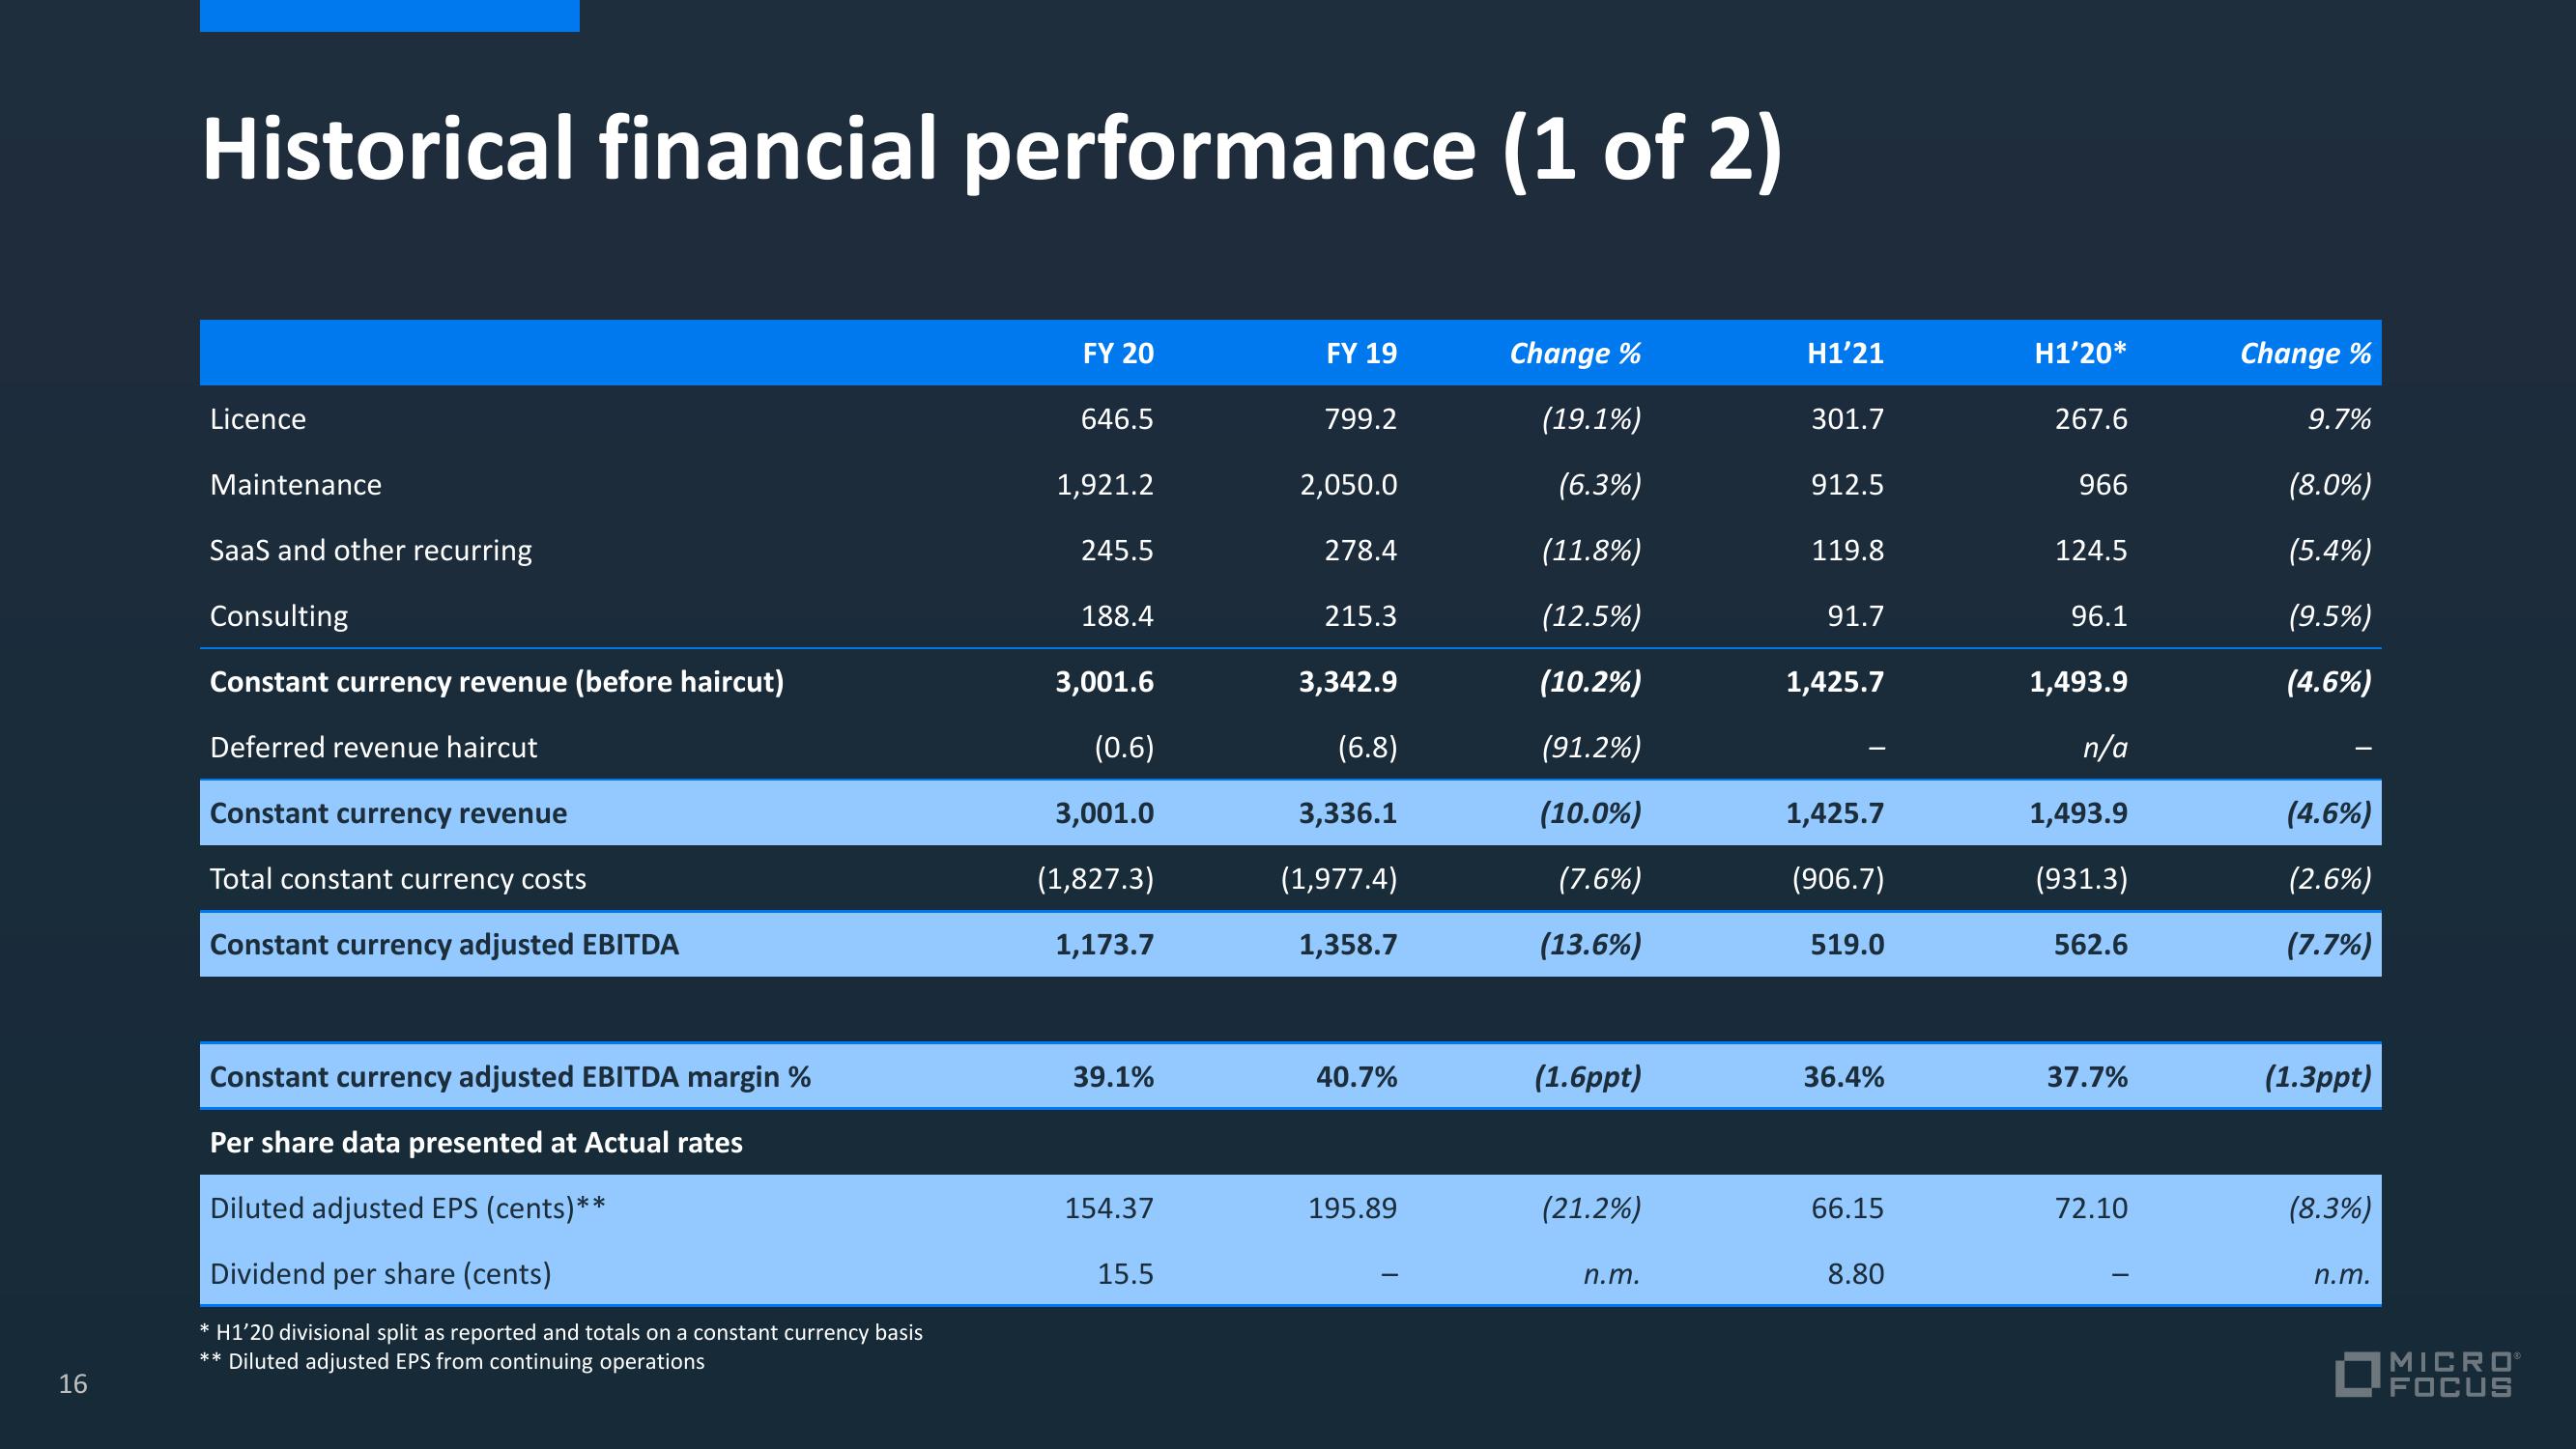
Historical financial performance (1 of 2)
Licence
Maintenance
SaaS and other recurring
Consulting
Constant currency revenue (before haircut)
Deferred revenue haircut
Constant currency revenue
Total constant currency costs
Constant currency adjusted EBITDA
Constant currency adjusted EBITDA margin %
Per share data presented at Actual rates
Diluted adjusted EPS (cents)**
Dividend per share (cents)
* H1'20 divisional split as reported and totals on a constant currency basis
** Diluted adjusted EPS from continuing operations
FY 20
646.5
1,921.2
245.5
188.4
3,001.6
(0.6)
3,001.0
(1,827.3)
1,173.7
39.1%
154.37
15.5
FY 19
799.2
2,050.0
278.4
215.3
3,342.9
(6.8)
3,336.1
(1,977.4)
1,358.7
40.7%
195.89
Change %
(19.1%)
(6.3%)
(11.8%)
(12.5%)
(10.2%)
(91.2%)
(10.0%)
(7.6%)
(13.6%)
(1.6ppt)
(21.2%)
n.m.
H1’21
301.7
912.5
119.8
91.7
1,425.7
1,425.7
(906.7)
519.0
36.4%
66.15
8.80
H1’20*
267.6
966
124.5
96.1
1,493.9
n/a
1,493.9
(931.3)
562.6
37.7%
72.10
Change %
9.7%
(8.0%)
(5.4%)
(9.5%)
(4.6%)
(4.6%)
(2.6%)
(7.7%)
(1.3ppt)
(8.3%)
n.m.
MICROⓇ
FOCUSView entire presentation