Grove SPAC Presentation Deck
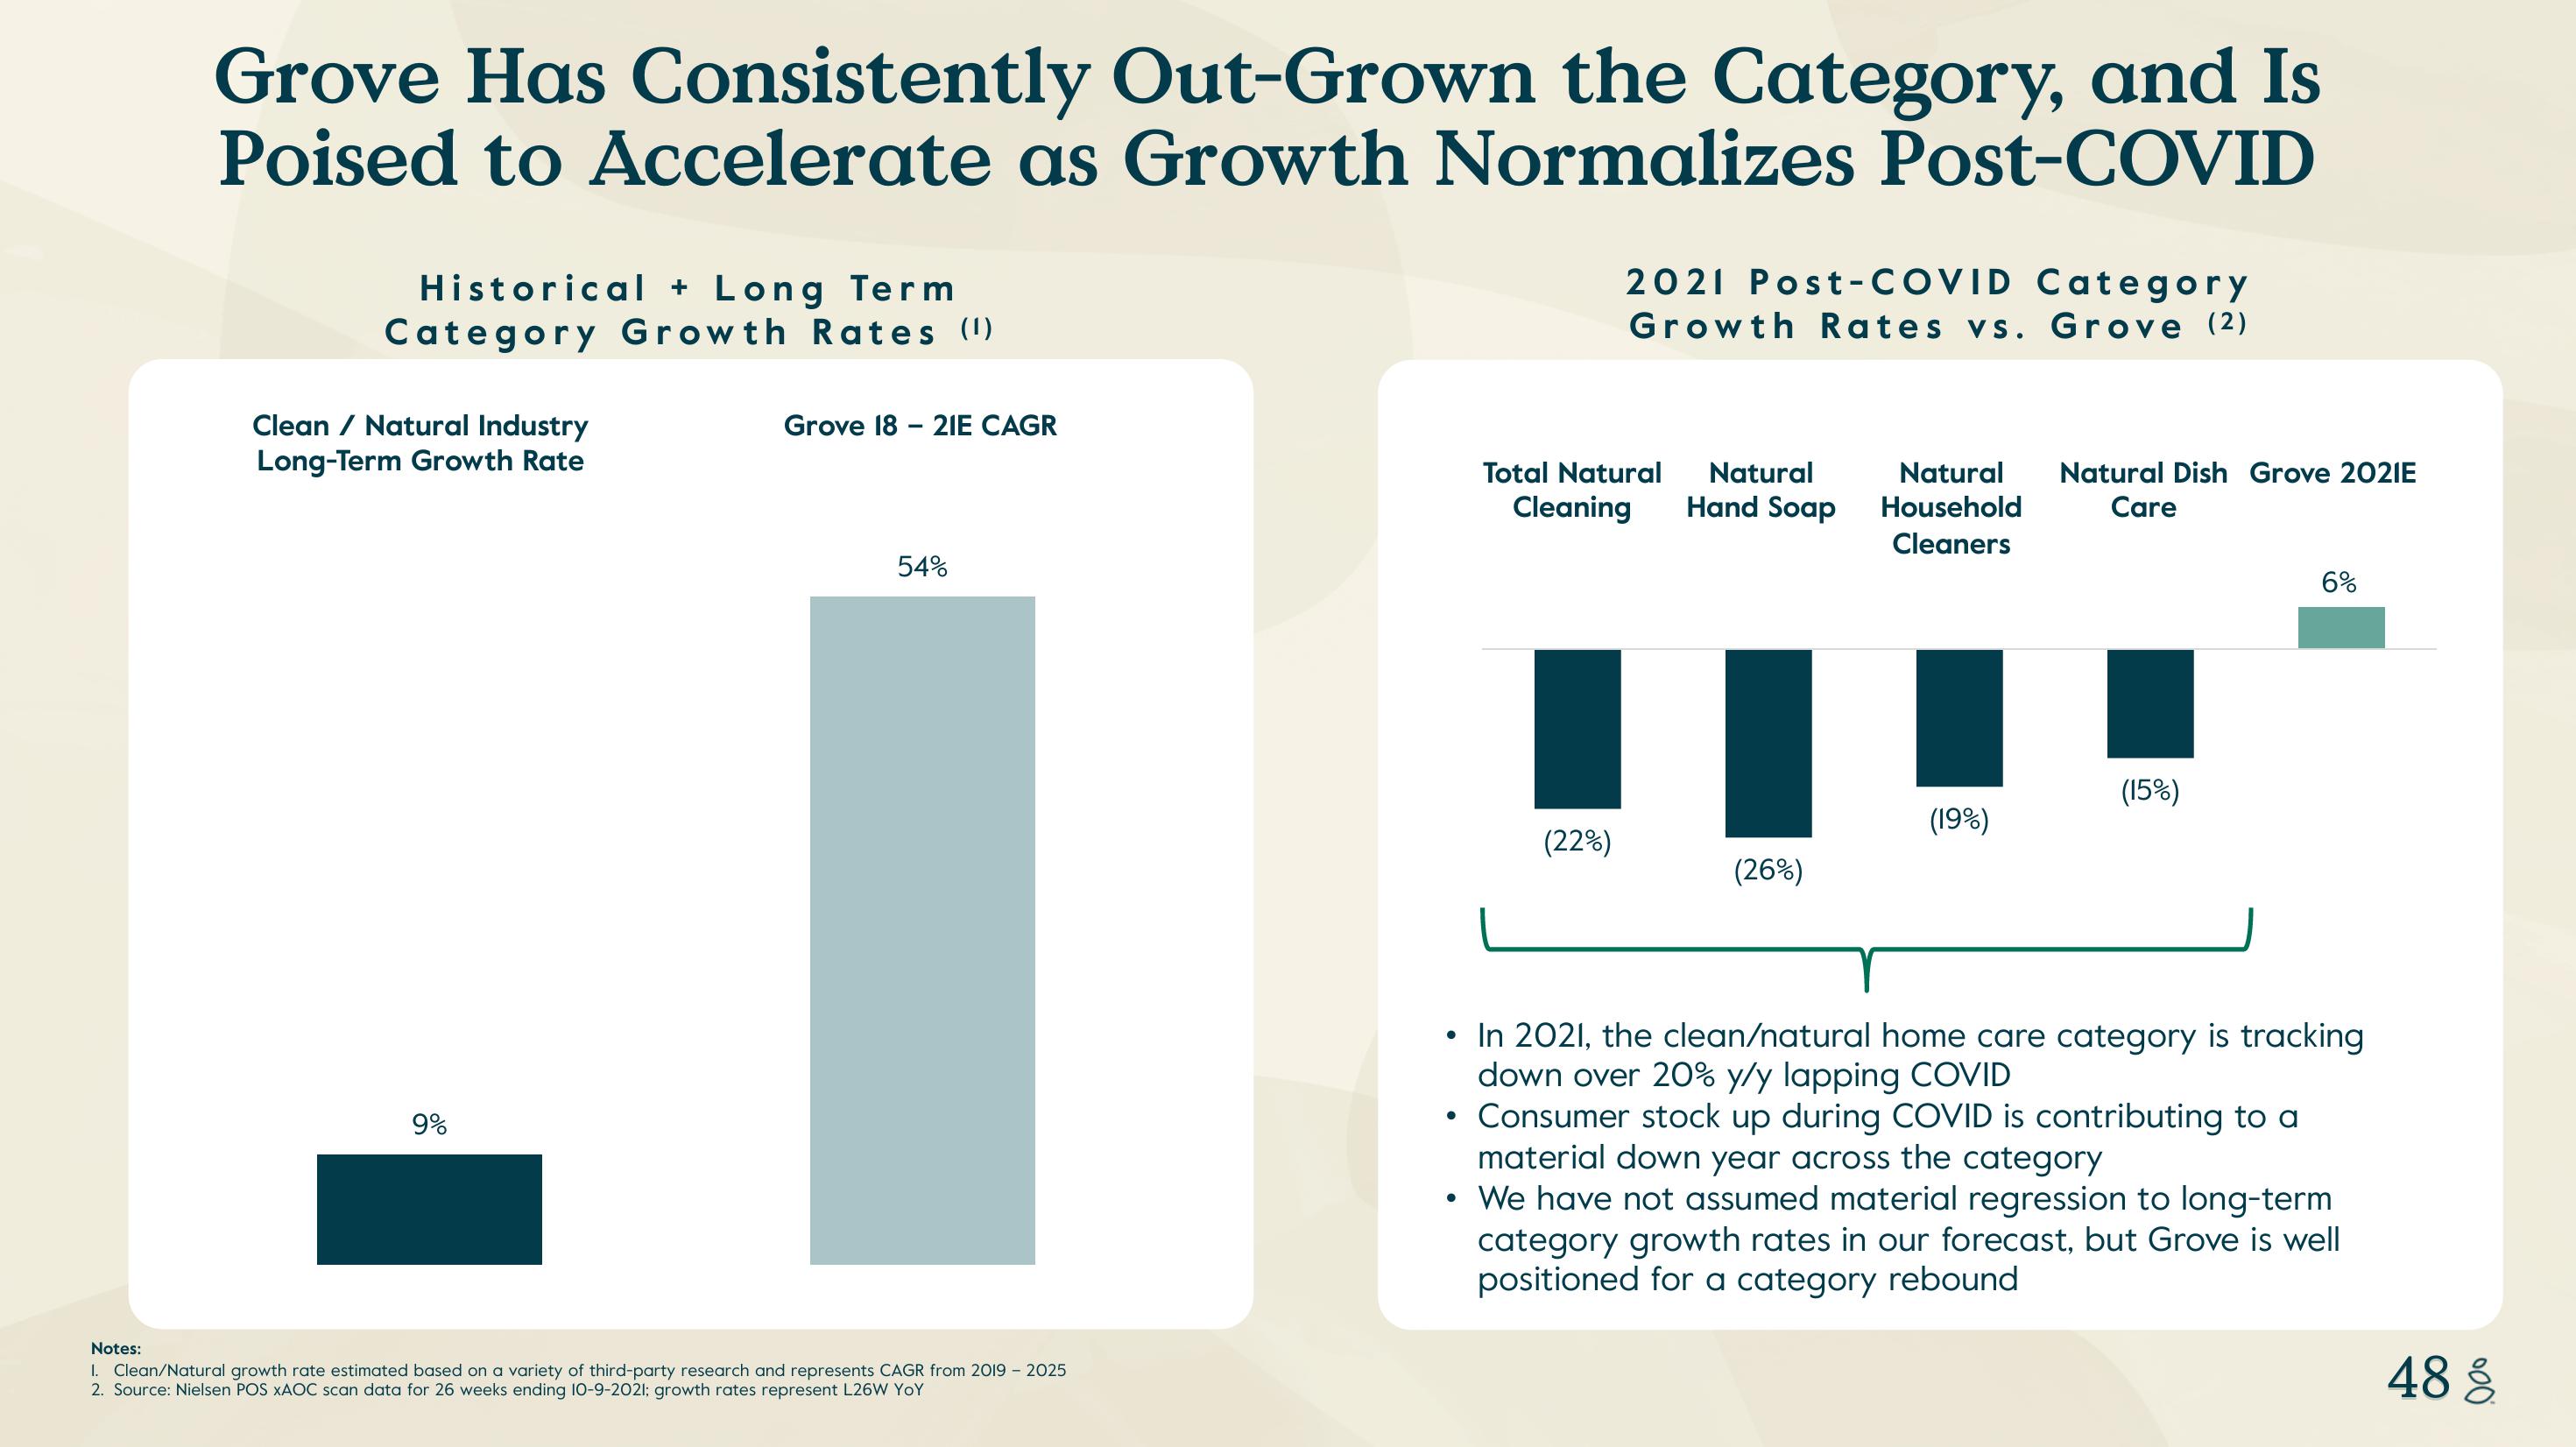
Grove Has Consistently Out-Grown the Category, and Is
Poised to Accelerate as Growth Normalizes Post-COVID
Historical Long Term
Category Growth Rates (1)
Clean / Natural Industry
Long-Term Growth Rate
9%
Grove 18 - 21E CAGR
54%
Notes:
I. Clean/Natural growth rate estimated based on a variety of third-party research and represents CAGR from 2019 - 2025
2. Source: Nielsen POS XAOC scan data for 26 weeks ending 10-9-2021; growth rates represent L26W YOY
●
●
2021 Post-COVID Category
Growth Rates vs. Grove (2)
Total Natural
Cleaning
(22%)
Natural
Hand Soap
(26%)
Natural
Household
Cleaners
(19%)
Natural Dish Grove 2021E
Care
(15%)
• In 2021, the clean/natural home care category is tracking
down over 20% y/y lapping COVID
Consumer stock up during COVID is contributing to a
material down year across the category
We have not assumed material regression to long-term
category growth rates in our forecast, but Grove is well
positioned for a category rebound
6%
48 %View entire presentation