Experian ESG Presentation Deck
Executive Summary
Improving Financial Health
Employees
Employee turnover
Voluntary employee turnover rate (attrition)
Involuntary employee turnover rate
Total employee turnover
Accidents with and without absence and number of lost days
North America
Latin America
UK & Ireland
EMEA
Asia Pacific
Total workforce
Lost time injury frequency rate
Lost time injury frequency rate
81
Data
O Experian Public
Employees
2022
2020
2019
2018
2016
Unit
%
78
76
75
76
68
Employee engagement
Employee engagement
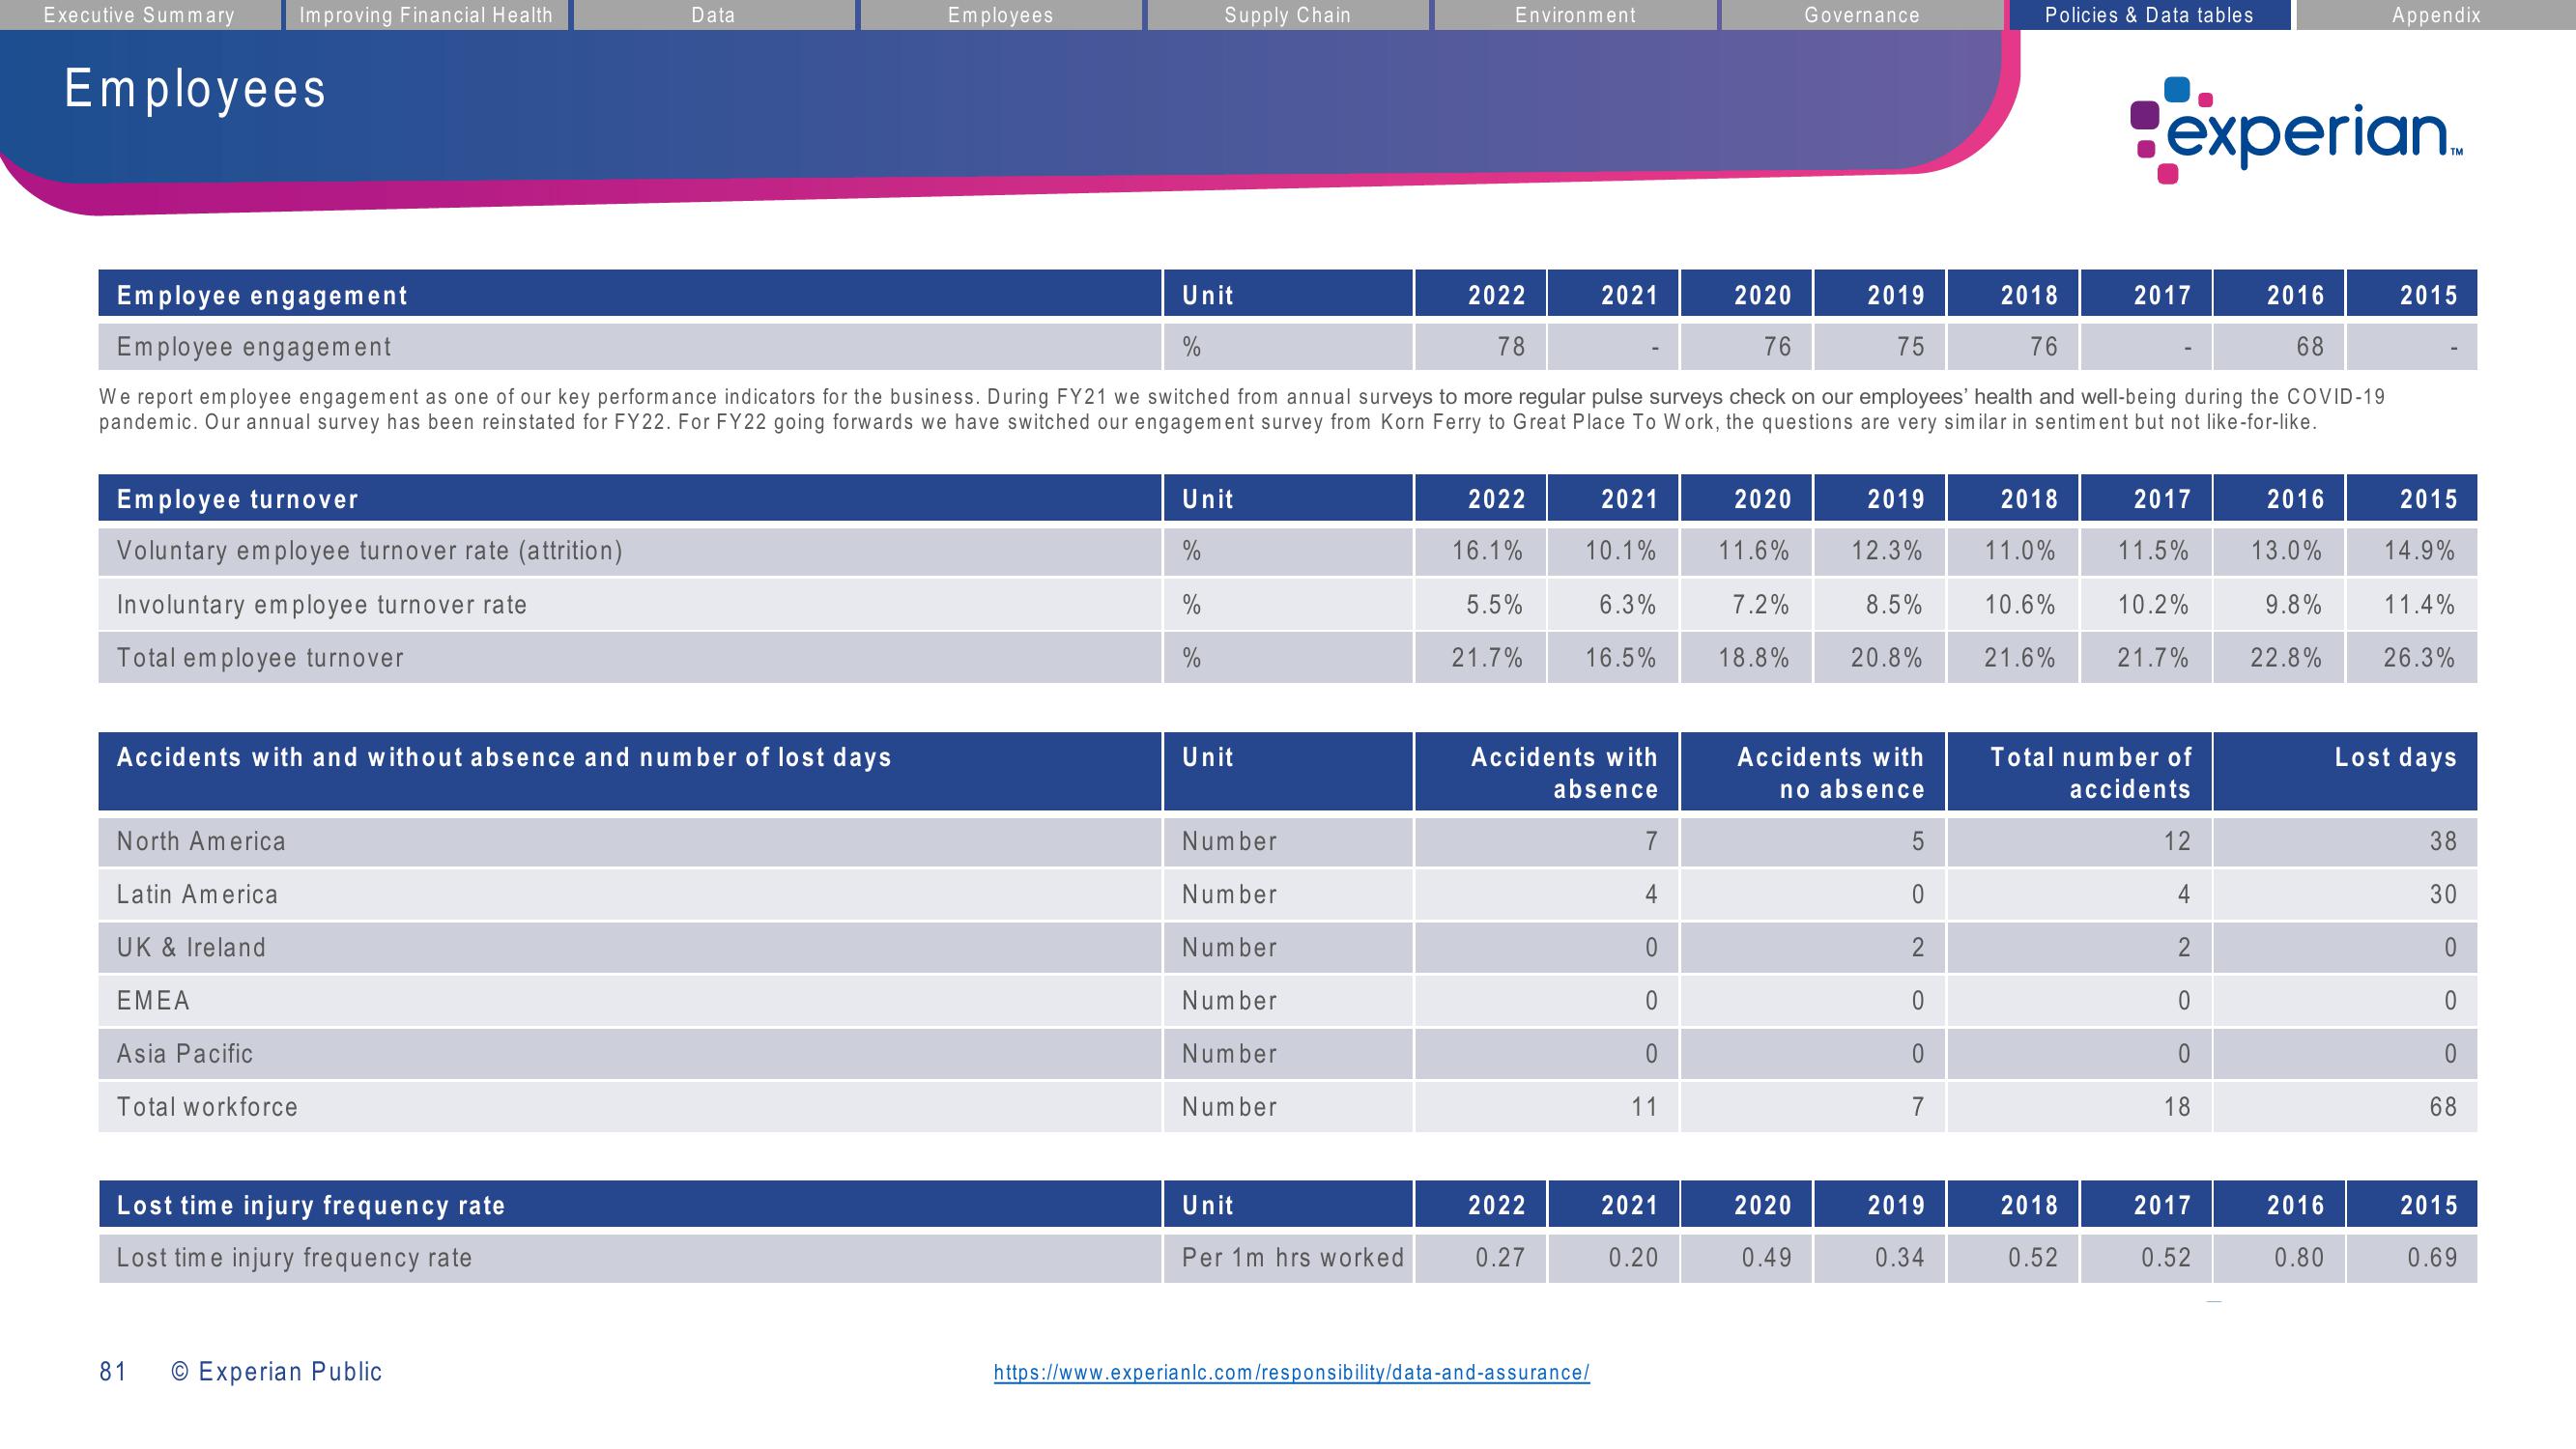
We report employee engagement as one of our key performance indicators for the business. During FY21 we switched from annual surveys to more regular pulse surveys check on our employees' health and well-being during the COVID-19
pandemic. Our annual survey has been reinstated for FY22. For FY22 going forwards we have switched our engagement survey from Korn Ferry to Great Place To Work, the questions are very similar in sentiment but not like-for-like.
Supply Chain
Unit
%
Unit
Number
Number
Number
Number
Number
Number
Environment
Unit
Per 1m hrs worked
2022
16.1%
5.5%
21.7%
2022
0.27
2021
2021
10.1%
6.3%
16.5%
Accidents with
absence
https://www.experianlc.com/responsibility/data-and-assurance/
7
4
0
0
0
11
2021
0.20
2020
11.6%
7.2%
18.8%
Governance
2020
0.49
2019
12.3%
8.5%
20.8%
Accidents with
no absence
LO
5
0
2
0
Policies & Data tables
2019
0.34
2018
11.0%
10.6%
21.6%
experian.
2018
0.52
2017
2017
11.5%
10.2%
21.7%
Total number of
accidents
12
4
2
0
0
18
2017
0.52
2016
13.0%
9.8%
22.8%
Appendix
2016
0.80
2015
2015
14.9%
11.4%
26.3%
Lost days
38
30
O
0
O
68
2015
0.69View entire presentation