Freshworks Investor Day Presentation Deck slide image

Freshworks Investor Day Presentation Deck

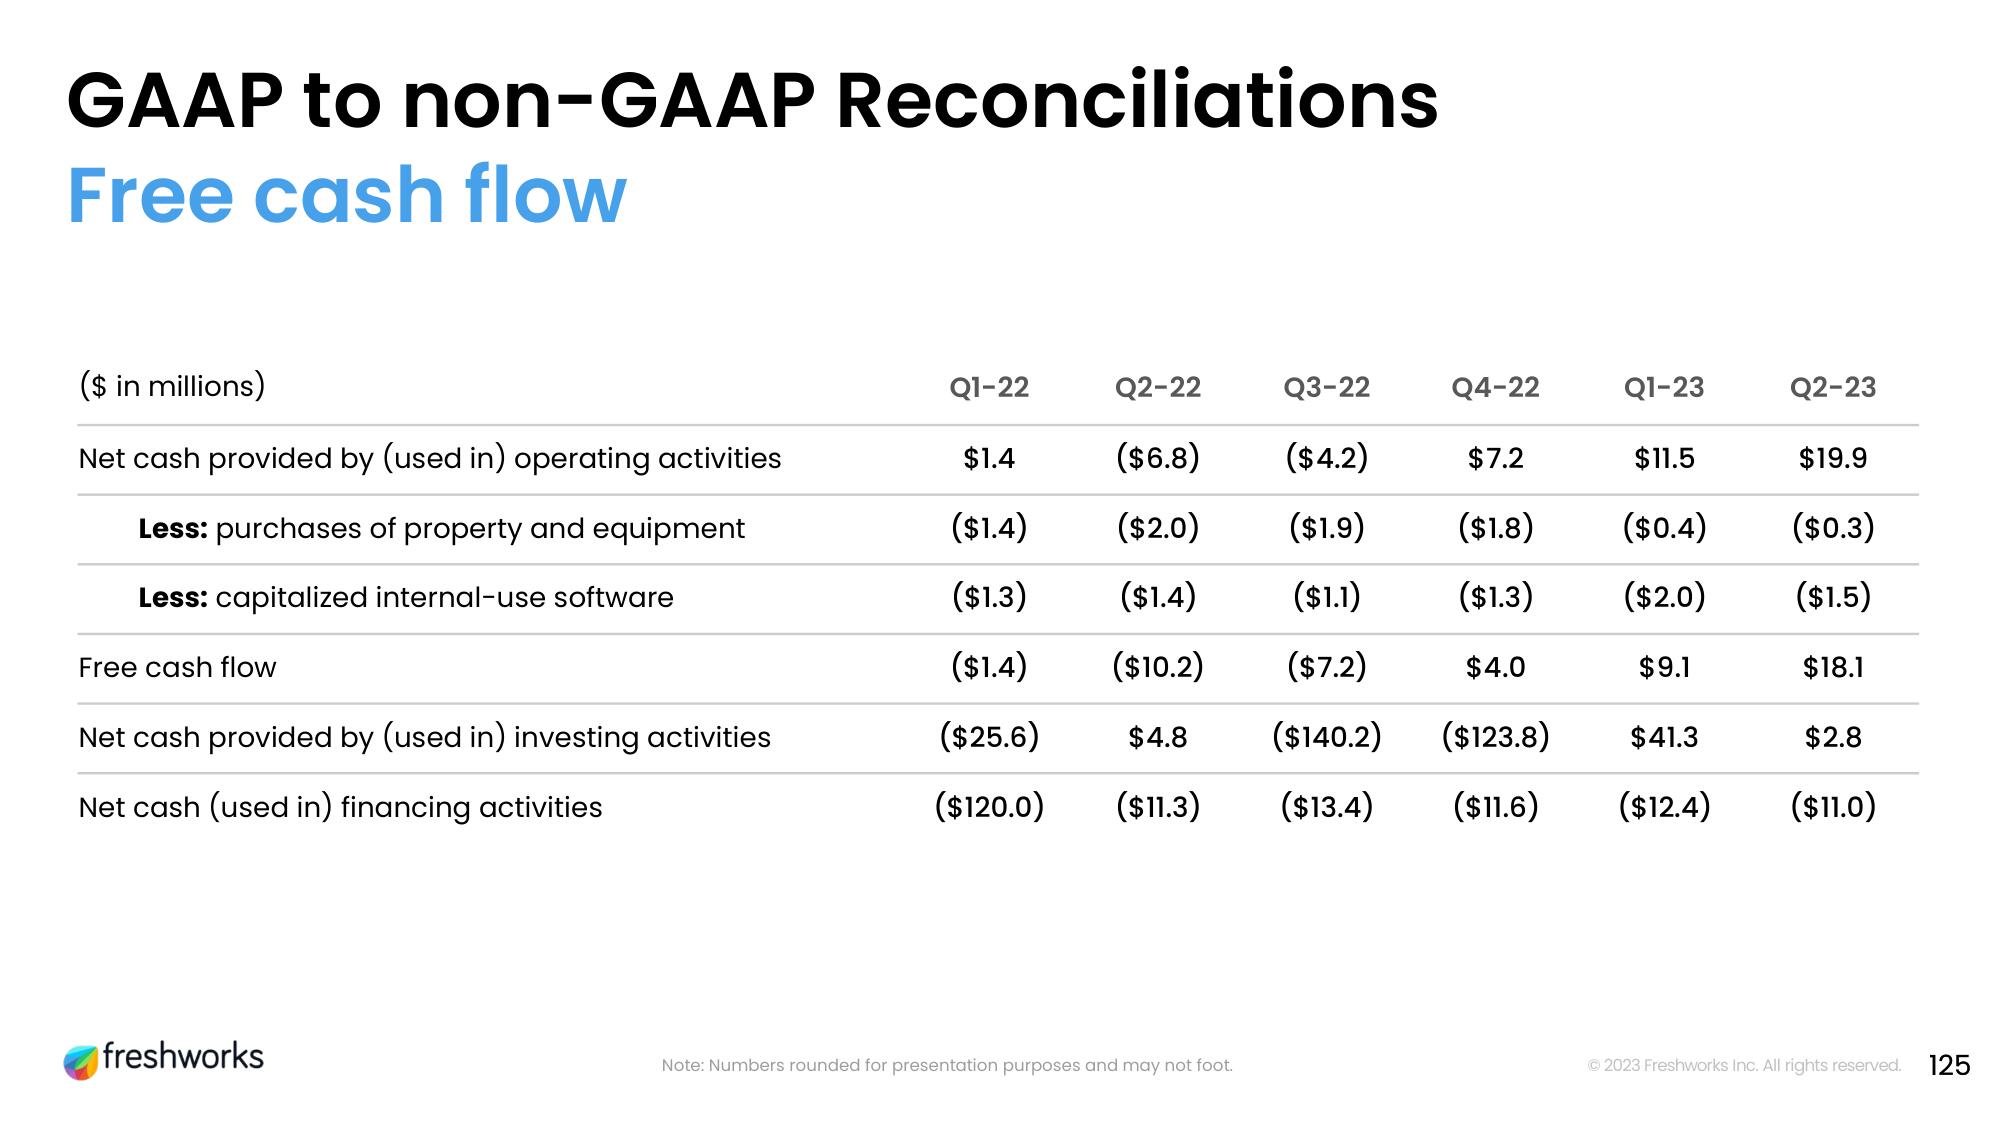
GAAP to non-GAAP Reconciliations Free cash flow ($ in millions) Net cash provided by (used in) operating activities Less: purchases of property and equipment Less: capitalized internal-use software Free cash flow Net cash provided by (used in) investing activities Net cash (used in) financing activities freshworks Q1-22 Q2-22 Q3-22 ($6.8) ($4.2) ($2.0) ($1.9) ($1.4) ($1.1) ($10.2) ($7.2) $4.8 ($140.2) ($123.8) ($13.4) ($11.6) $1.4 ($1.4) ($1.3) ($1.4) ($25.6) ($120.0) ($11.3) Note: Numbers rounded for presentation purposes and may not foot. Q4-22 Q1-23 $7.2 $11.5 ($1.8) ($0.4) ($1.3) ($2.0) $4.0 $9.1 Q2-23 $19.9 ($0.3) ($1.5) $18.1 $41.3 $2.8 ($12.4) ($11.0) Ⓒ2023 Freshworks Inc. All rights reserved. 125
View entire presentation