JD Sports Results Presentation Deck
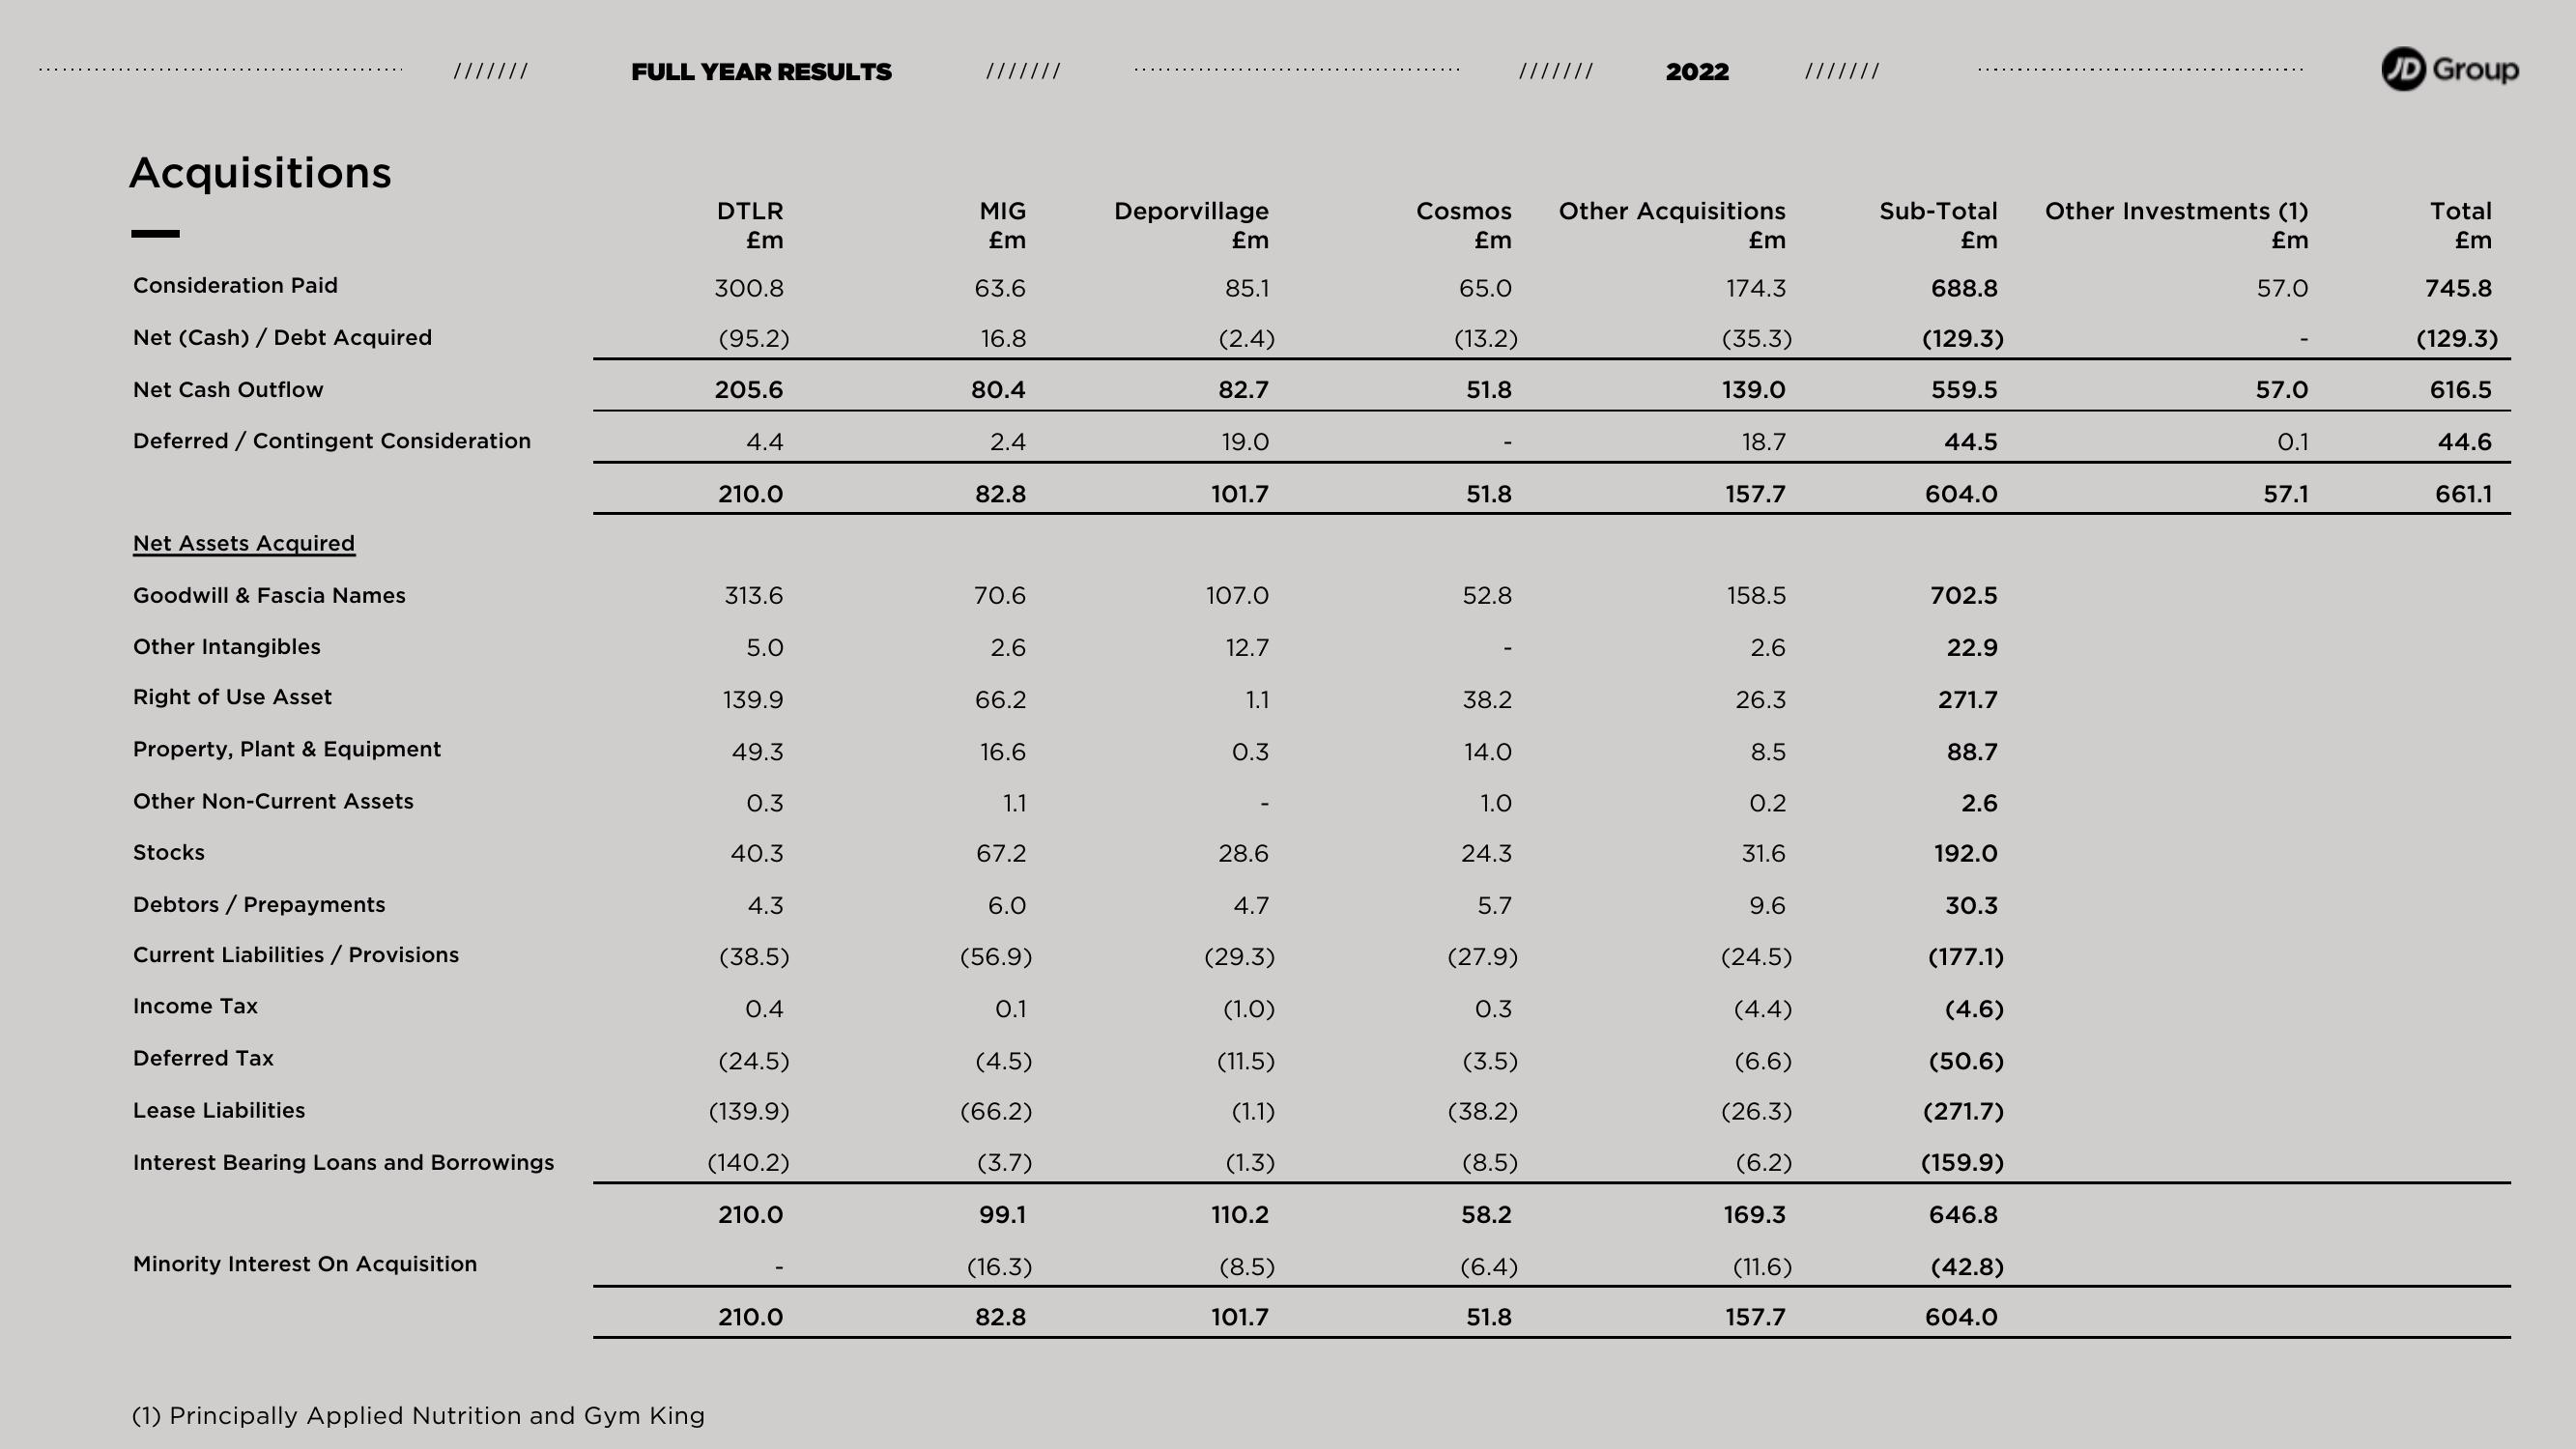
Acquisitions
Consideration Paid
Net (Cash) / Debt Acquired
Net Cash Outflow
Deferred / Contingent Consideration
Net Assets Acquired
Goodwill & Fascia Names
Other Intangibles
Right of Use Asset
Property, Plant & Equipment
Other Non-Current Assets
Stocks
Debtors / Prepayments
Current Liabilities / Provisions
Income Tax
Deferred Tax
Lease Liabilities
Interest Bearing Loans and Borrowings
Minority Interest On Acquisition
FULL YEAR RESULTS
(1) Principally Applied Nutrition and Gym King
DTLR
£m
300.8
(95.2)
205.6
4.4
210.0
313.6
5.0
139.9
49.3
0.3
40.3
4.3
(38.5)
0.4
(24.5)
(139.9)
(140.2)
210.0
210.0
MIG
£m
63.6
16.8
80.4
2.4
82.8
70.6
2.6
66.2
16.6
1.1
67.2
6.0
(56.9)
0.1
(4.5)
(66.2)
(3.7)
99.1
(16.3)
82.8
Deporvillage
£m
85.1
(2.4)
82.7
19.0
101.7
107.0
12.7
1.1
0.3
28.6
4.7
(29.3)
(1.0)
(11.5)
(1.1)
(1.3)
110.2
(8.5)
101.7
Cosmos Other Acquisitions
£m
65.0
(13.2)
51.8
51.8
52.8
38.2
14.0
1.0
24.3
5.7
(27.9)
0.3
(3.5)
(38.2)
(8.5)
58.2
2022
(6.4)
51.8
£m
174.3
(35.3)
139.0
18.7
157.7
158.5
2.6
26.3
8.5
0.2
31.6
9.6
(24.5)
(4.4)
(6.6)
(26.3)
(6.2)
169.3
(11.6)
157.7
///////
Sub-Total Other Investments (1)
£m
£m
57.0
688.8
(129.3)
559.5
44.5
604.0
702.5
22.9
271.7
88.7
2.6
192.0
30.3
(177.1)
(4.6)
(50.6)
(271.7)
(159.9)
646.8
(42.8)
604.0
57.0
0.1
57.1
JD Group
Total
£m
745.8
(129.3)
616.5
44.6
661.1View entire presentation