Aston Martin Results Presentation Deck
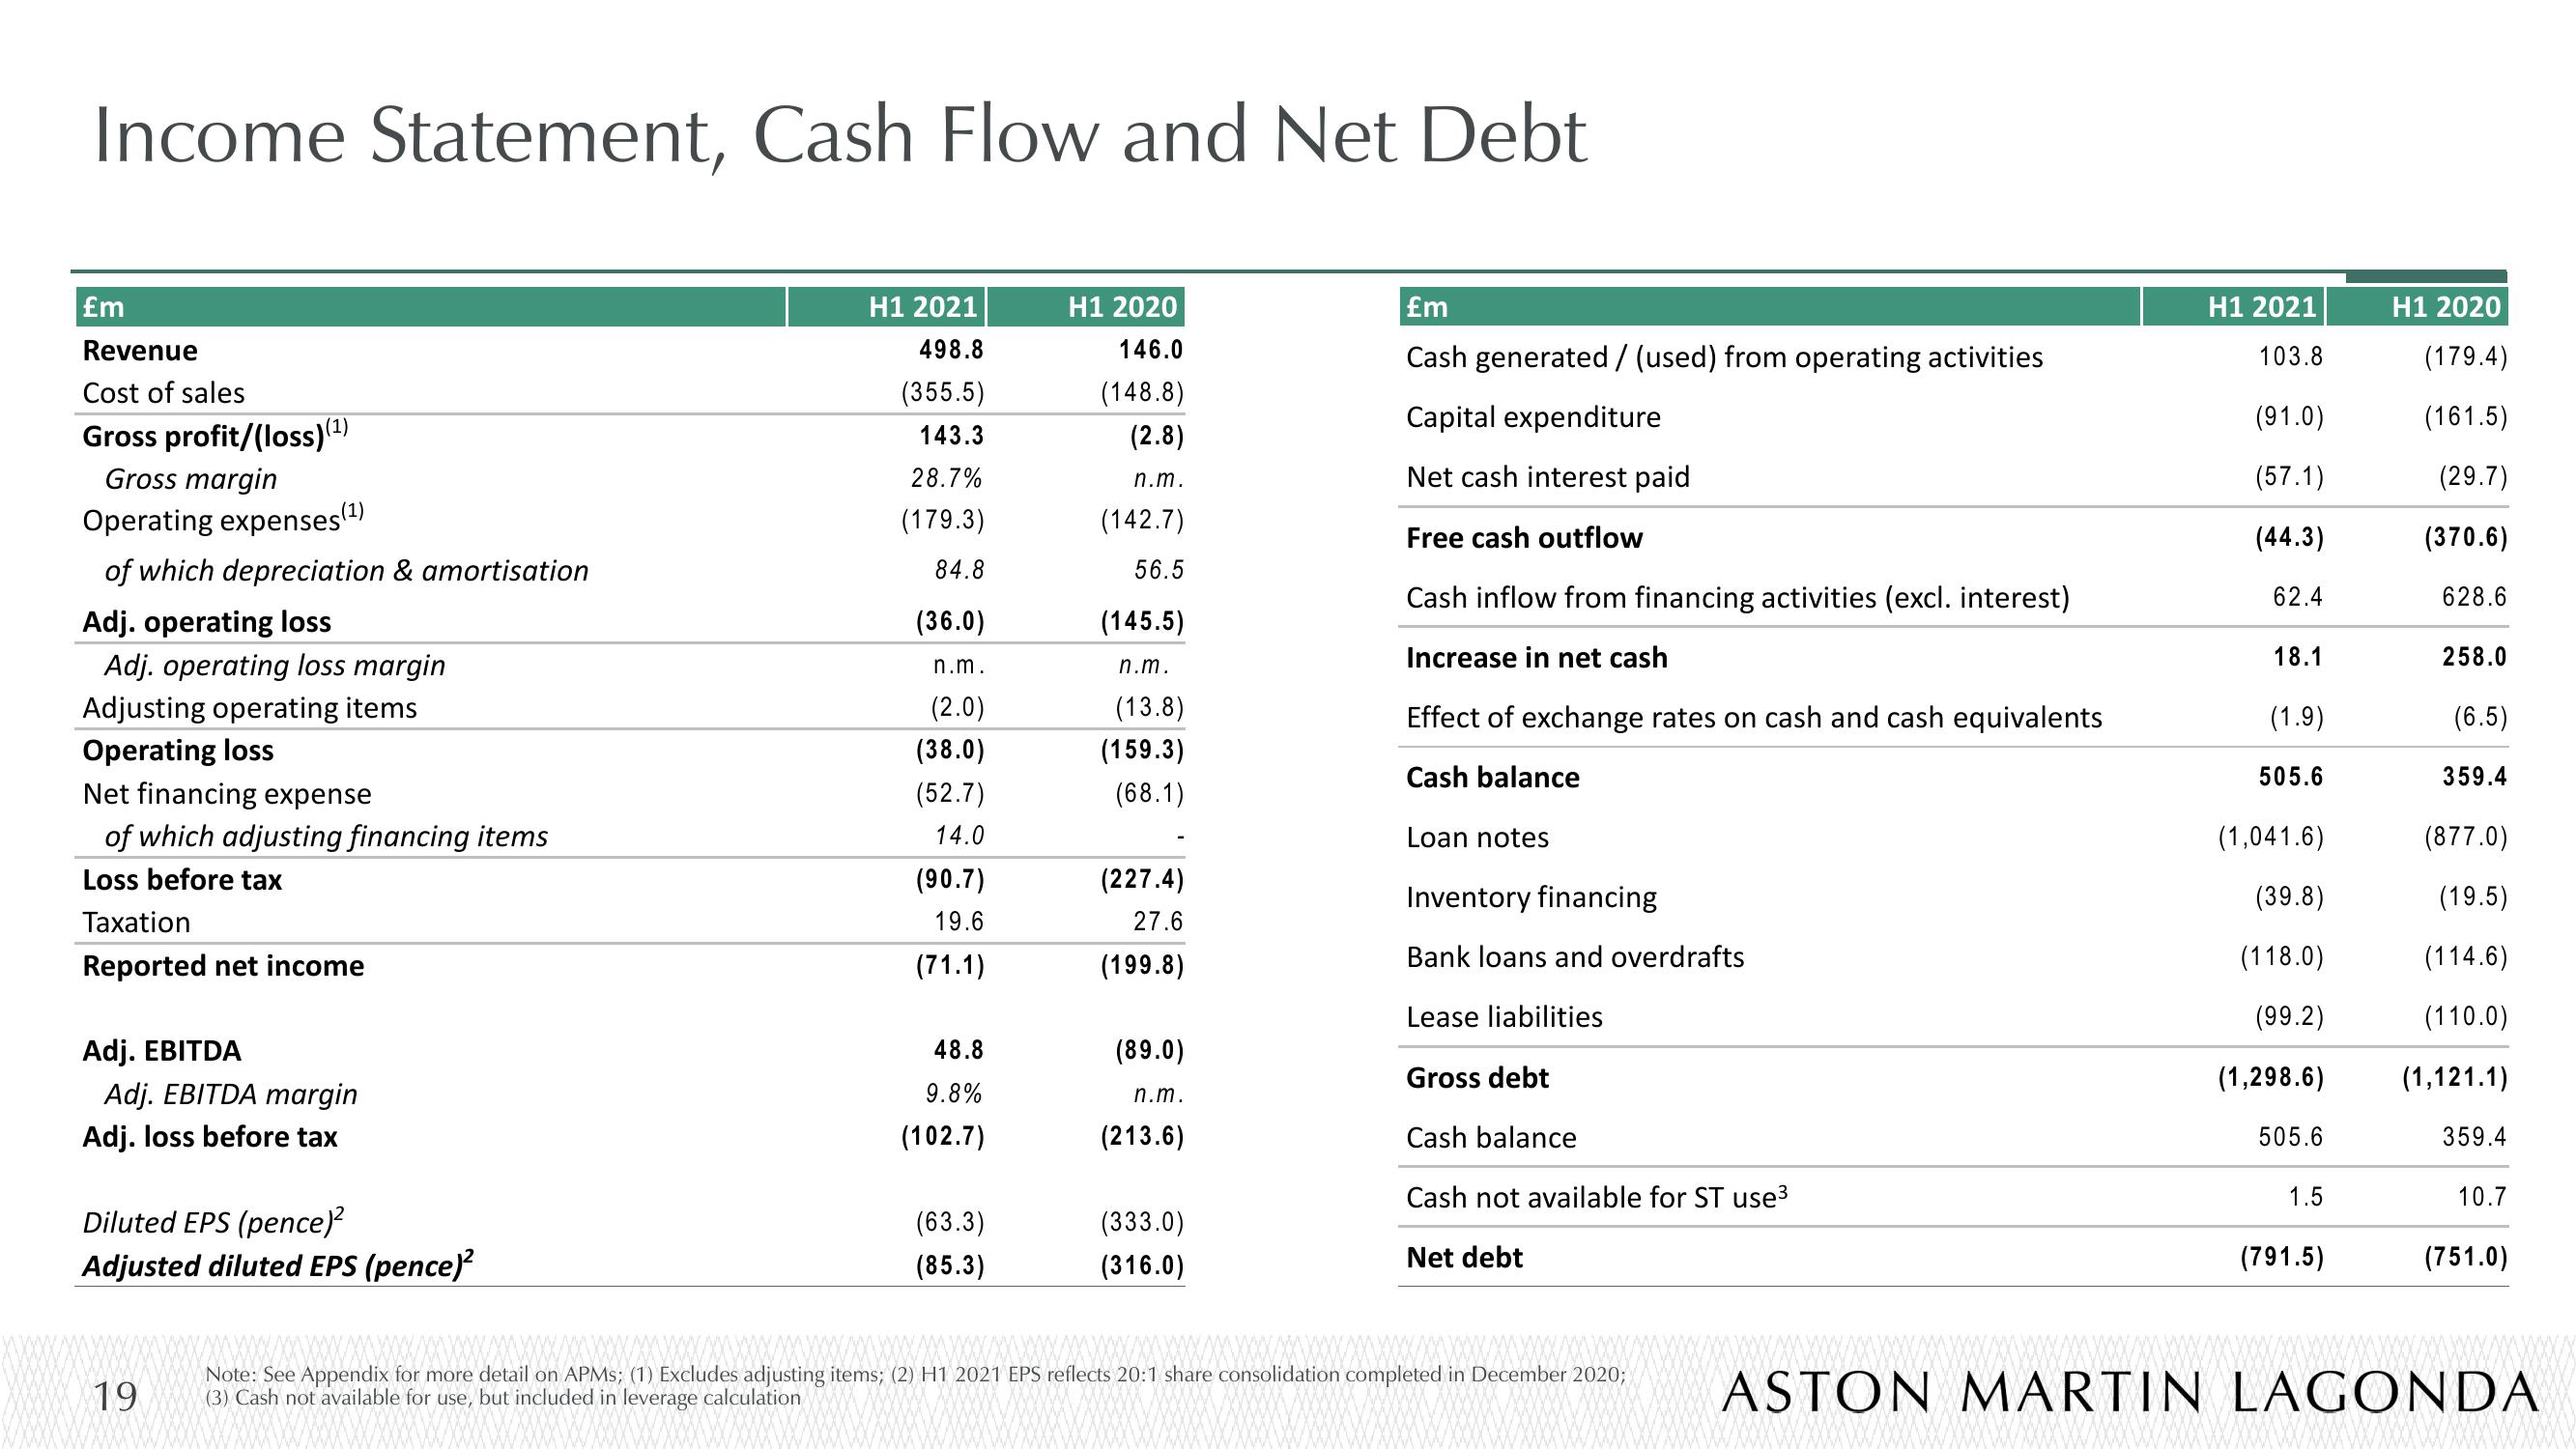
Income Statement, Cash Flow and Net Debt
£m
Revenue
Cost of sales
Gross profit/(loss) (¹)
Gross margin
Operating expenses (¹)
of which depreciation & amortisation
Adj. operating loss
Adj. operating loss margin
Adjusting operating items
Operating loss
Net financing expense
of which adjusting financing items
Loss before tax
Taxation
Reported net income
Adj. EBITDA
Adj. EBITDA margin
Adj. loss before tax
Diluted EPS (pence)²
Adjusted diluted EPS (pence)²
19
H1 2021
498.8
(355.5)
143.3
28.7%
(179.3)
84.8
(36.0)
n.m.
(2.0)
(38.0)
(52.7)
14.0
(90.7)
19.6
(71.1)
48.8
9.8%
(102.7)
(63.3)
(85.3)
H1 2020
146.0
(148.8)
(2.8)
n.m.
(142.7)
56.5
(145.5)
n.m.
(13.8)
(159.3)
(68.1)
(227.4)
27.6
(199.8)
(89.0)
n.m.
(213.6)
(333.0)
(316.0)
£m
Cash generated / (used) from operating activities
Capital expenditure
Net cash interest paid
Free cash outflow
Cash inflow from financing activities (excl. interest)
Increase in net cash
Effect of exchange rates on cash and cash equivalents
Cash balance
Loan notes
Inventory financing
Bank loans and overdrafts
Lease liabilities
Gross debt
Cash balance
Cash not available for ST use³
Net debt
Note: See Appendix for more detail on APMs; (1) Excludes adjusting items; (2) H1 2021 EPS reflects 20:1 share consolidation completed in December 2020;
(3) Cash not available for use, but included in leverage calculation
H1 2021
103.8
(91.0)
(57.1)
(44.3)
62.4
18.1
(1.9)
505.6
(1,041.6)
(39.8)
(118.0)
(99.2)
(1,298.6)
505.6
1.5
(791.5)
H1 2020
(179.4)
(161.5)
(29.7)
(370.6)
628.6
258.0
(6.5)
359.4
(877.0)
(19.5)
(114.6)
(110.0)
(1,121.1)
359.4
10.7
(751.0)
wwwwwwwwwwwwwwwwwwwwwwwwwwwwwwww
ASTON MARTIN LAGONDAView entire presentation