Evercore Investment Banking Pitch Book
Executive Summary
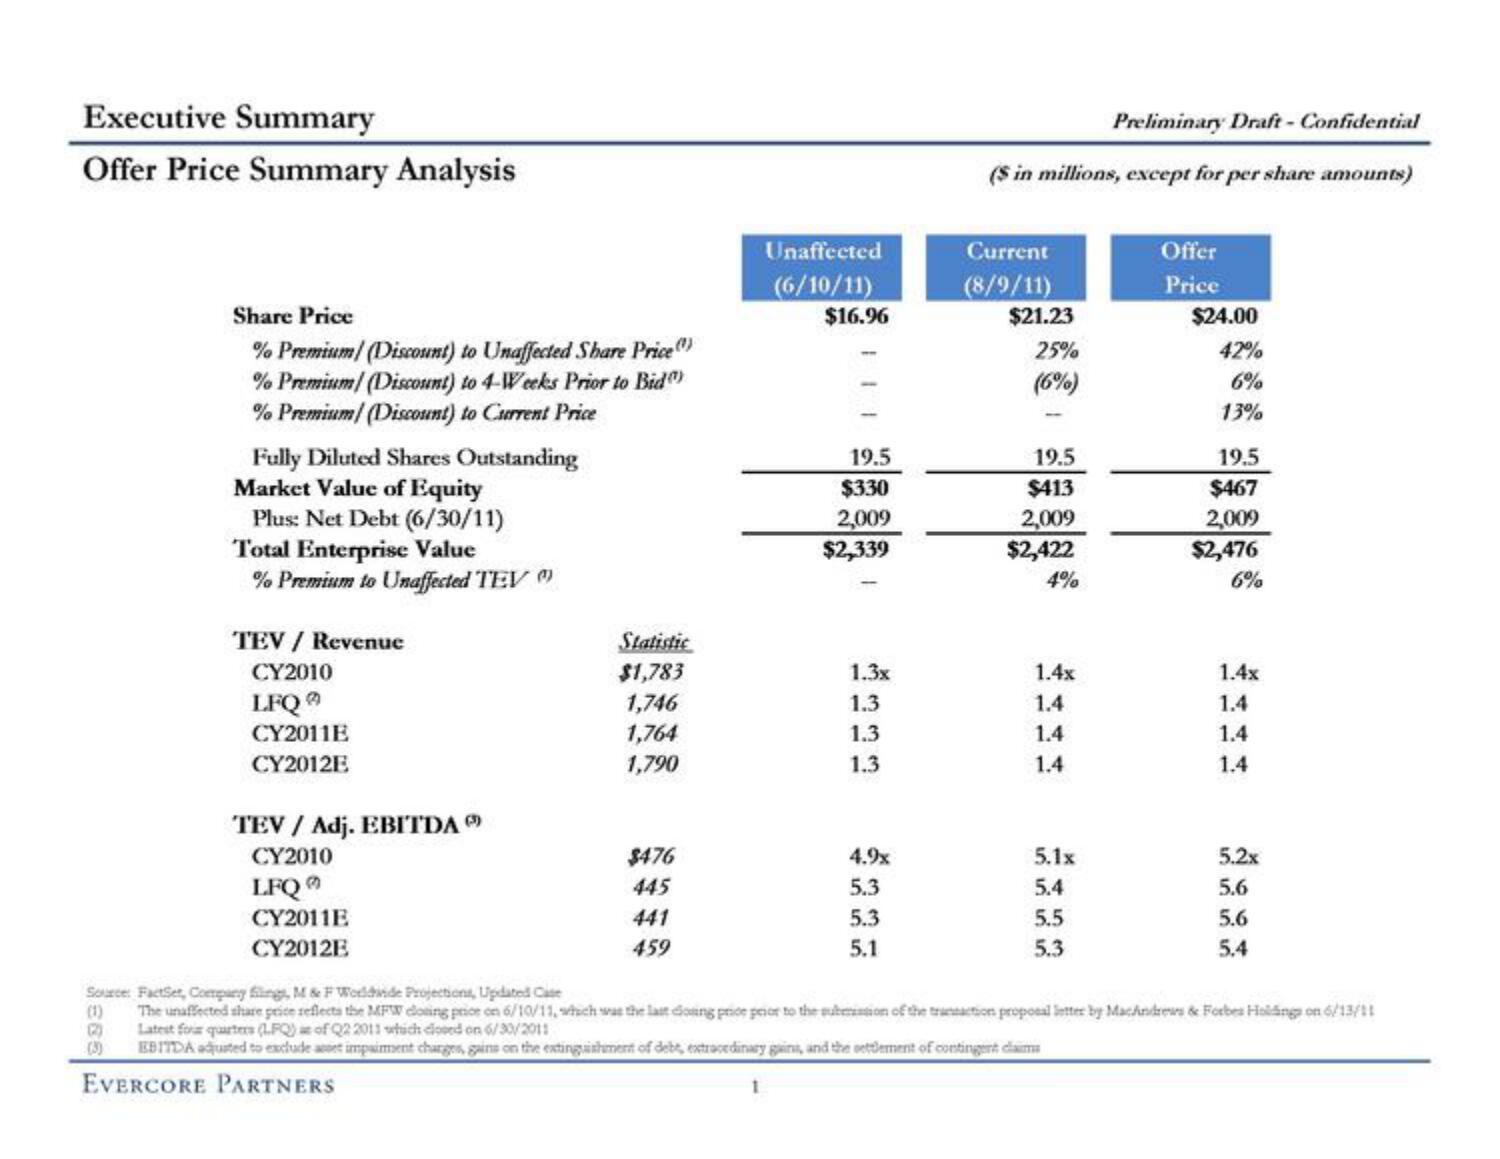
Offer Price Summary Analysis
Share Price
% Premium/ (Discount) to Unaffected Share Price
% Premium/ (Discount) to 4-Weeks Prior to Bid
% Premium/ (Discount) to Current Price
(1)
(
Fully Diluted Shares Outstanding
Market Value of Equity
Plus: Net Debt (6/30/11)
Total Enterprise Value
% Premium to Unaffected TEV
TEV / Revenue
CY2010
LFQ
CY2011E
CY2012E
TEV / Adj. EBITDA
CY2010
LFQ
CY2011E
CY2012E
Statistic
$1,783
1,746
1,764
1,790
$476
445
441
459
Unaffected
(6/10/11)
$16.96
19.5
$330
2,009
$2,339
1
1.3x
1.3
1.3
1.3
4.9x
5.3
5.3
5.1
Preliminary Draft-Confidential
($ in millions, except for per share amounts)
Current
(8/9/11)
$21.23
25%
(6%)
19.5
$413
2,009
$2,422
4%
1.4x
1.4
1.4
1.4
5.1x
5.4
5.5
5.3
Offer
Price
$24.00
42%
6%
13%
19.5
$467
2,009
$2,476
6%
1.4x
1.4
1.4
1.4
5.2x
5.6
5.6
5.4
Source: FactSet, Company filings, M & F Worldhinde Projections, Updated Case
The unaffected share price reflects the MFW eloning price on 6/10/11, which was the last doing price prior to the submission of the transaction proposal letter by MacAndrews & Forbes Holdings on 6/13/11
Latest four quarters (LFQ) of Q2 2011 which dooed on 6/30/2011
EBITDA adjusted to exclude art impaiment charges, gains on the extinguishment of debt, extracedinary gains, and the settlement of contingent claims
EVERCORE PARTNERSView entire presentation