Apollo Global Management Investor Day Presentation Deck
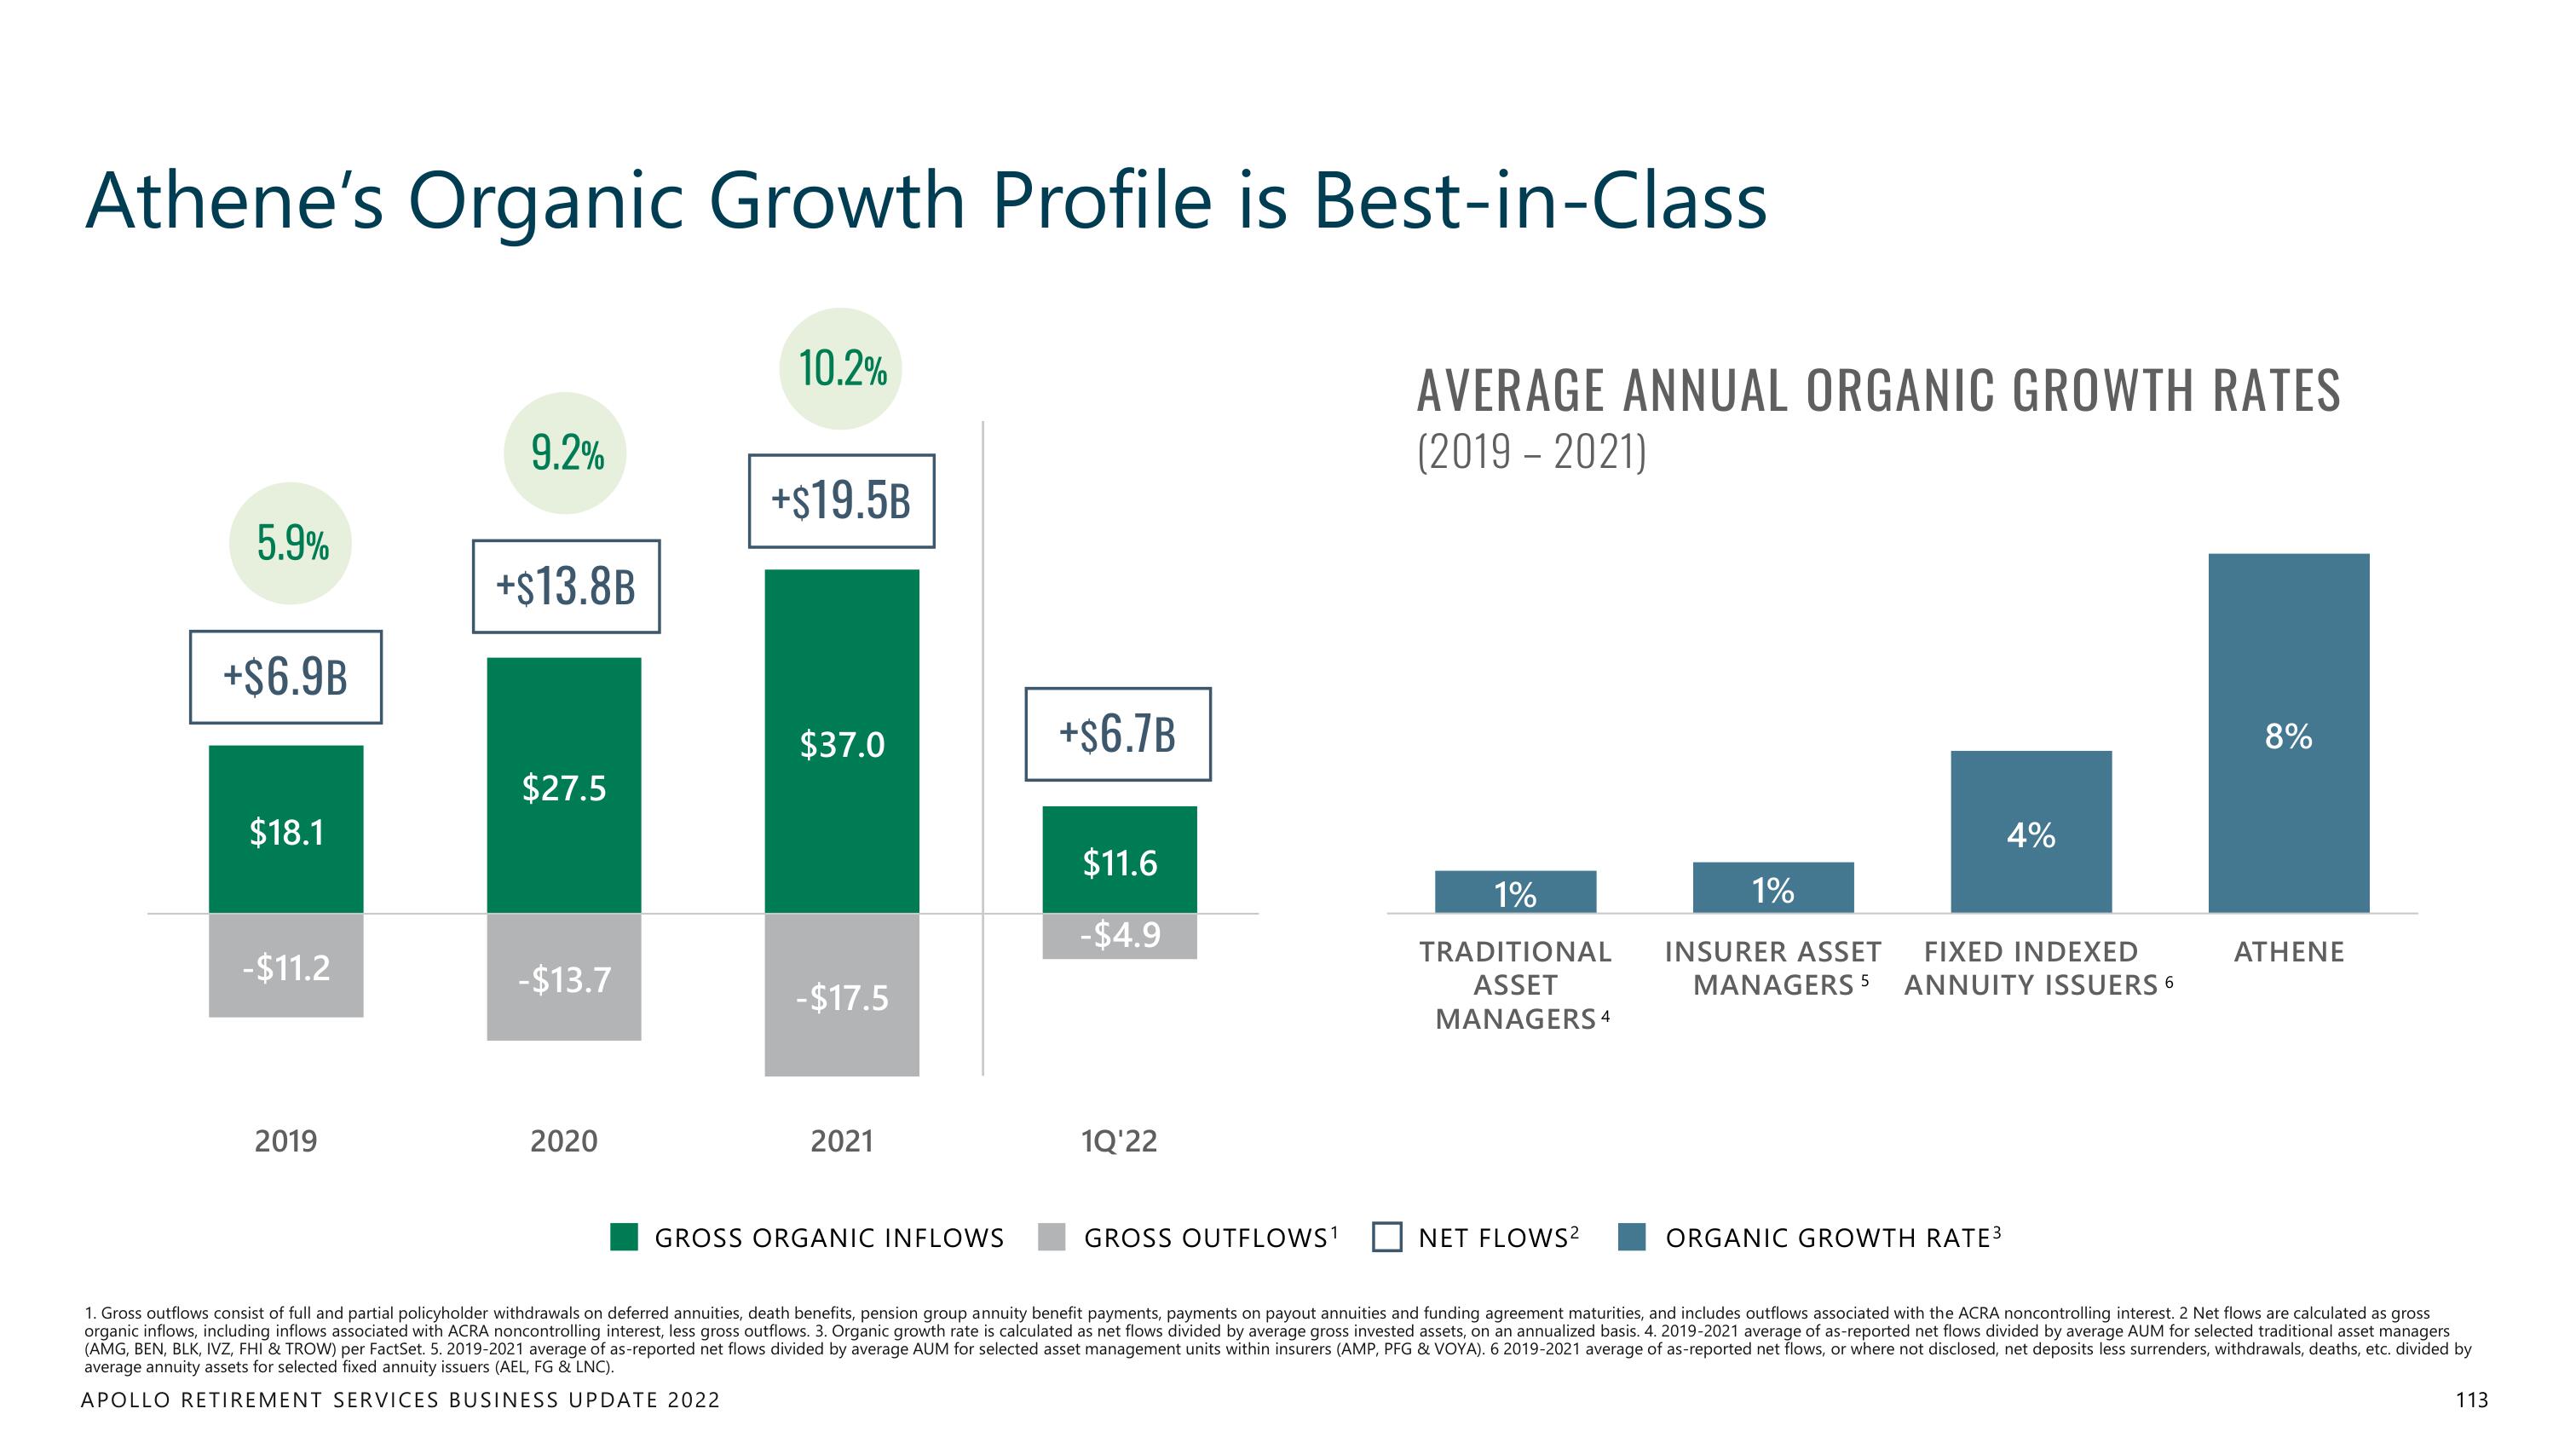
Athene's Organic Growth Profile is Best-in-Class
5.9%
+$6.9B
$18.1
-$11.2
2019
9.2%
+$13.8B
$27.5
-$13.7
2020
10.2%
+$19.5B
$37.0
-$17.5
2021
GROSS ORGANIC INFLOWS
+$6.7B
$11.6
-$4.9
1Q'22
GROSS OUTFLOWS¹
AVERAGE ANNUAL ORGANIC GROWTH RATES
(2019-2021)
1%
TRADITIONAL
ASSET
MANAGERS 4
NET FLOWS²
1%
INSURER ASSET
MANAGERS 5
4%
FIXED INDEXED
ANNUITY ISSUERS 6
ORGANIC GROWTH RATE³
8%
ATHENE
1. Gross outflows consist of full and partial policyholder withdrawals on deferred annuities, death benefits, pension group annuity benefit payments, payments on payout annuities and funding agreement maturities, and includes outflows associated with the ACRA noncontrolling interest. 2 Net flows are calculated as gross
organic inflows, including inflows associated with ACRA noncontrolling interest, less gross outflows. 3. Organic growth rate is calculated as net flows divided by average gross invested assets, on an annualized basis. 4. 2019-2021 average of as-reported net flows divided by average AUM for selected traditional asset managers
(AMG, BEN, BLK, IVZ, FHI & TROW) per FactSet. 5. 2019-2021 average of as-reported net flows divided by average AUM for selected asset management units within insurers (AMP, PFG & VOYA). 6 2019-2021 average of as-reported net flows, or where not disclosed, net deposits less surrenders, withdrawals, deaths, etc. divided by
average annuity assets for selected fixed annuity issuers (AEL, FG & LNC).
APOLLO RETIREMENT SERVICES BUSINESS UPDATE 2022
113View entire presentation