Credit Suisse Investment Banking Pitch Book
CONFIDENTIAL
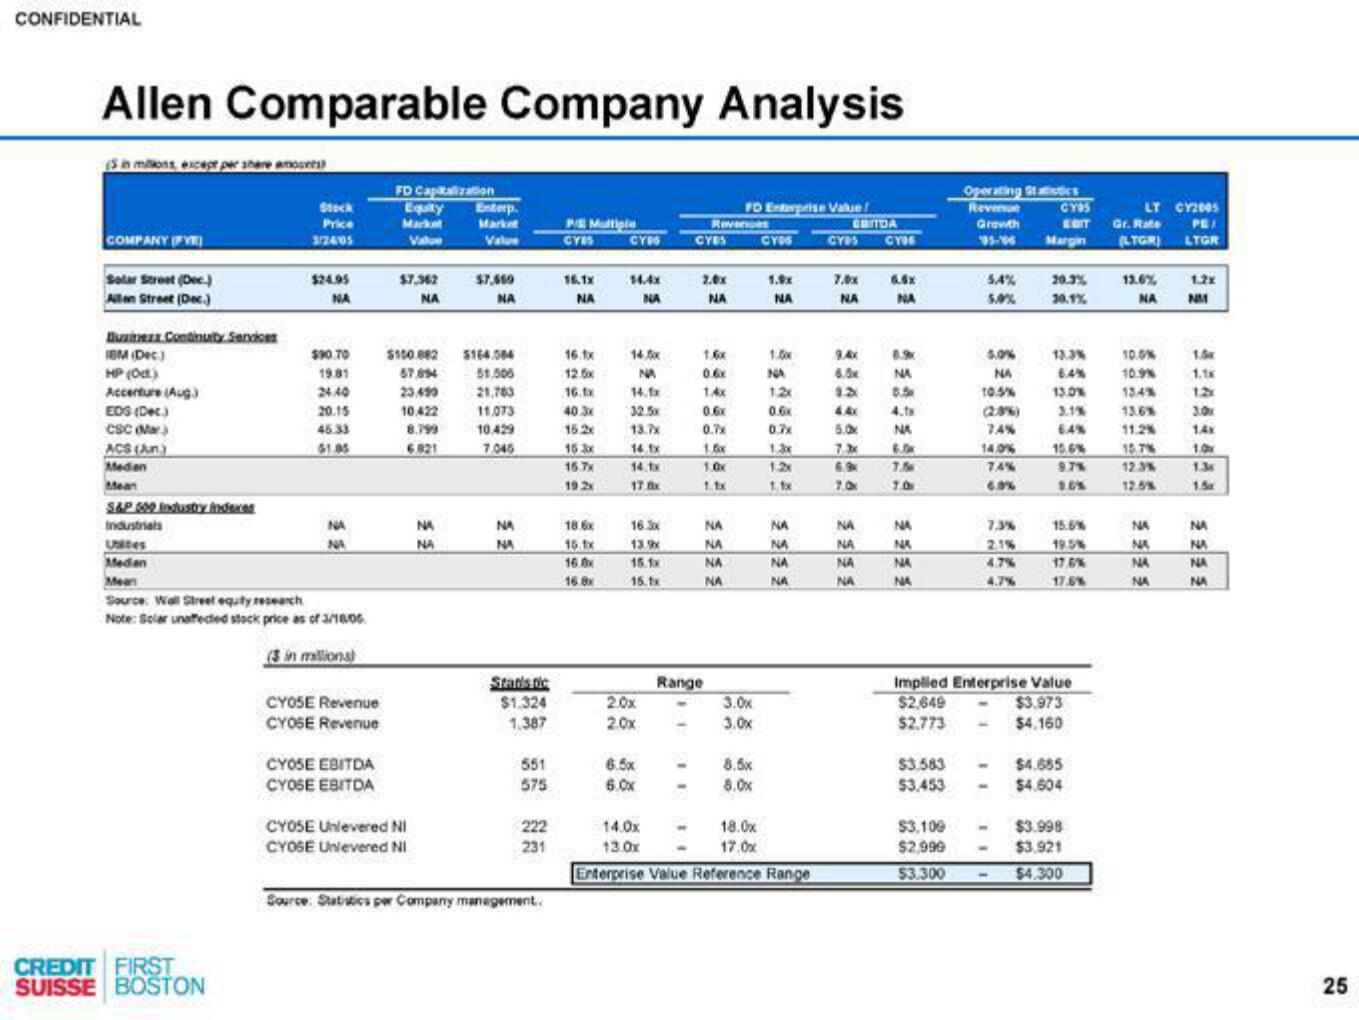
Allen Comparable Company Analysis
(5 in millions, except per share amets)
COMPANY YE
Solar Street (Dec.)
Allan Street (Dec.)
Buitex Continuity Services
IEM (Dec
HP (Oct.)
Accenture (Aug.)
EDS (Dec.)
CSC (Mar)
ACS (An)
Median
Mean
S&P 509 Industry Indexes
Industrials
Uites
Medan
Mean
Stock
Price
3/24/05
CREDIT FIRST
SUISSE BOSTON
$24.95
NA
$90.70
19.81
24.40
20.15
45.33
61.05
NA
NA
Source: Wall Street equity research
Note: Solar unaffected stock price as of 3/18/05
(3 in millions)
CY05E Revenue
CYOSE Revenue
CYOSE EBITDA
CYOSE EBITDA
FD Capitalization
Equity Enterp
Market
Value
Value
$7,362
NA
$150.882
67,894
23.490
10.422
8.799
6.821
CYOSE Unlevered NI
CYOSE Unlevered NI
NA
NA
$7,659
NA
$164.504
51.506
21,783
11.073
10,429
7.046
NA
NA
Statistic
$1.324
1.387
551
575
222
231
Source: Statistics per Company management.
PE Multiple
GYES
16.1x
NA
16.1x
126
16.tx
40.3x
15.2x
15 3x
15.7x
19 2x
18.6x
15.tx
16.0x
16.8x
CYS
14.4x
NA
anh n
NA
14.1x
13.7x
14.1x
14.tx
17.flx
16.3x
13.9x
15.tx
2.0x
2.0x
6.5x
6.0x
CYES
Revenues
2.0x
NA
0.6x
1.4x
0.6x
0.7x
Range
1.0x
1.1x
FO Enterprise Value
NA
NA
NA
NA
3.0x
3.0x
8.5x
8.0x
18.0x
- 17.0x
CYDS
1.9x
NA
1.0x
NA
1.2x
0.6x
0.7x
1.3x
1.2x
1.1x
NA
NA
NA
NA
14.0x
13.0x
Enterprise Value Reference Range
EBITDA
CYDS CYBE
7,0x
NA
6.0x
1.2
5.0M
6.9
7.0M
NA
NA
NA
NA
6.6x
NA
8.9
NA
8.5
4.tx
NA
7.5
7.0
NA
NA
NA
NA
$3.583
$3,453
Operating Statistics
Revenue
Growth
95-96
$3,109
$2,999
$3.300
5.4%
5.0%
NA
10.5%
74%
14.0%
74%
6.0%
7,3%
2.1%
4.7%
4.7%
-
CY95
EDIT
Margin
-
20.3%
13.3%
6.4%
13.0%
Implied Enterprise Value
$2,649
$2,773
3.1%
6.4%
10.6%
9.7%
15.6%
19.5%
17,6%
17.6%
$3.973
$4.160
$4.685
$4.604
$3.998
$3.921
$4.300
LT CY2005
Gr. Rate
(LTGR)
13.6%
10.5%
10.9%
13.4%
13.6%
11.2%
10.7%
12.3%
12.5%
NA NM
2222
NA
NA
NA
PE/
LTGR
NA
1.2x
1.5
1.1K
1.2x
3.0x
1.4x
1.3s
NA
NA
NA
NA
25View entire presentation