Theranos Investor Conference Presentation Deck
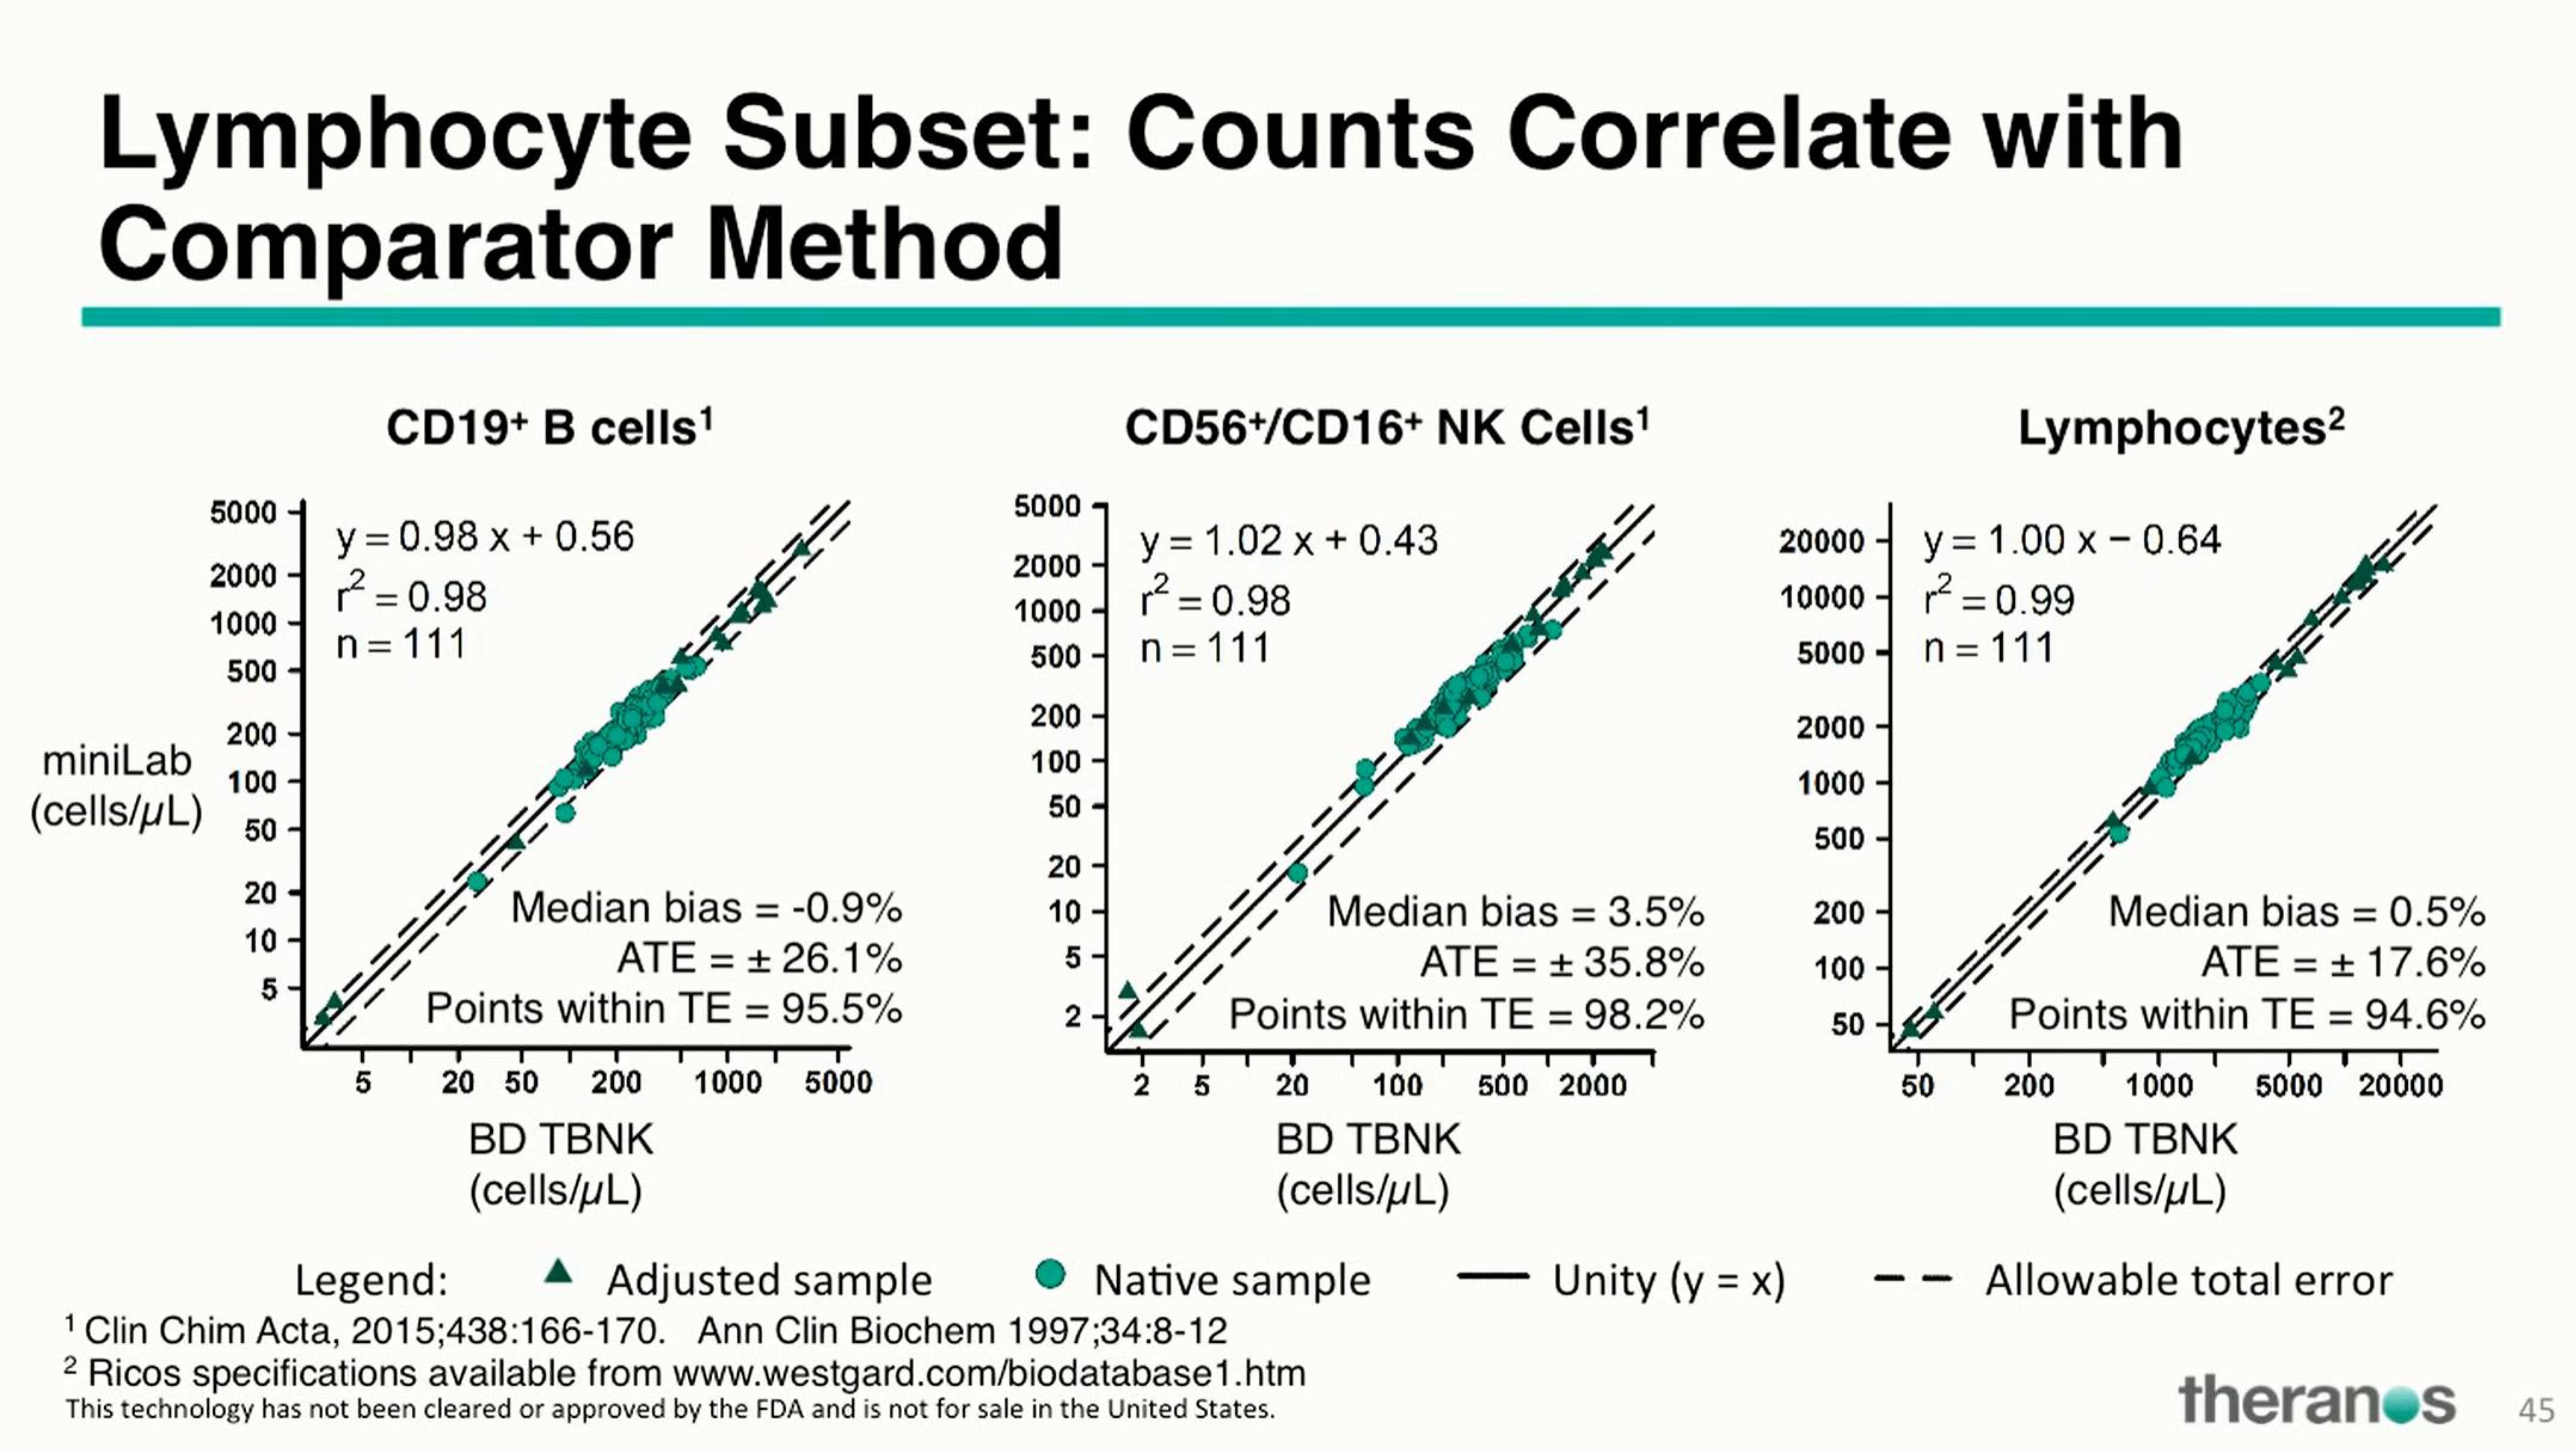
Lymphocyte Subset: Counts Correlate with
Comparator Method
miniLab
(cells/μL)
5000
2000
1000
500
200-
100
50
20
10
5
CD19+ B cells¹
y = 0.98 x + 0.56
r² = 0.98
n=111
5
N
Median bias = -0.9%
ATE = 26.1%
Points within TE = 95.5%
20 50 200 1000 5000
BD TBNK
(cells/μL)
5000
2000
1000
500
200
100
50
20
10
5
2
CD56+/CD16+ NK Cells¹
y = 1.02 x + 0.43
r² = 0.98
n=111
2
5
Median bias = 3.5%
ATE=35.8%
Points within TE = 98.2%
20 100 500 2000
BD TBNK
(cells/μL)
Legend:
Adjusted sample
Native sample
¹ Clin Chim Acta, 2015;438:166-170. Ann Clin Biochem 1997;34:8-12
2 Ricos specifications available from www.westgard.com/biodatabase1.htm
This technology has not been cleared or approved by the FDA and is not for sale in the United States.
-
20000
10000
5000-
Unity (y = x)
2000
1000
500
200
100
50
y = 1.00 x 0.64
r² = 0.99
n = 111
50
Lymphocytes²
--
BE
Median bias = 0.5%
ATE= 17.6%
Points within TE = 94.6%
T
200
1000 5000 20000
BD TBNK
(cells/μL)
Allowable total error
theranos
45View entire presentation