Kinnevik Results Presentation Deck
Intro
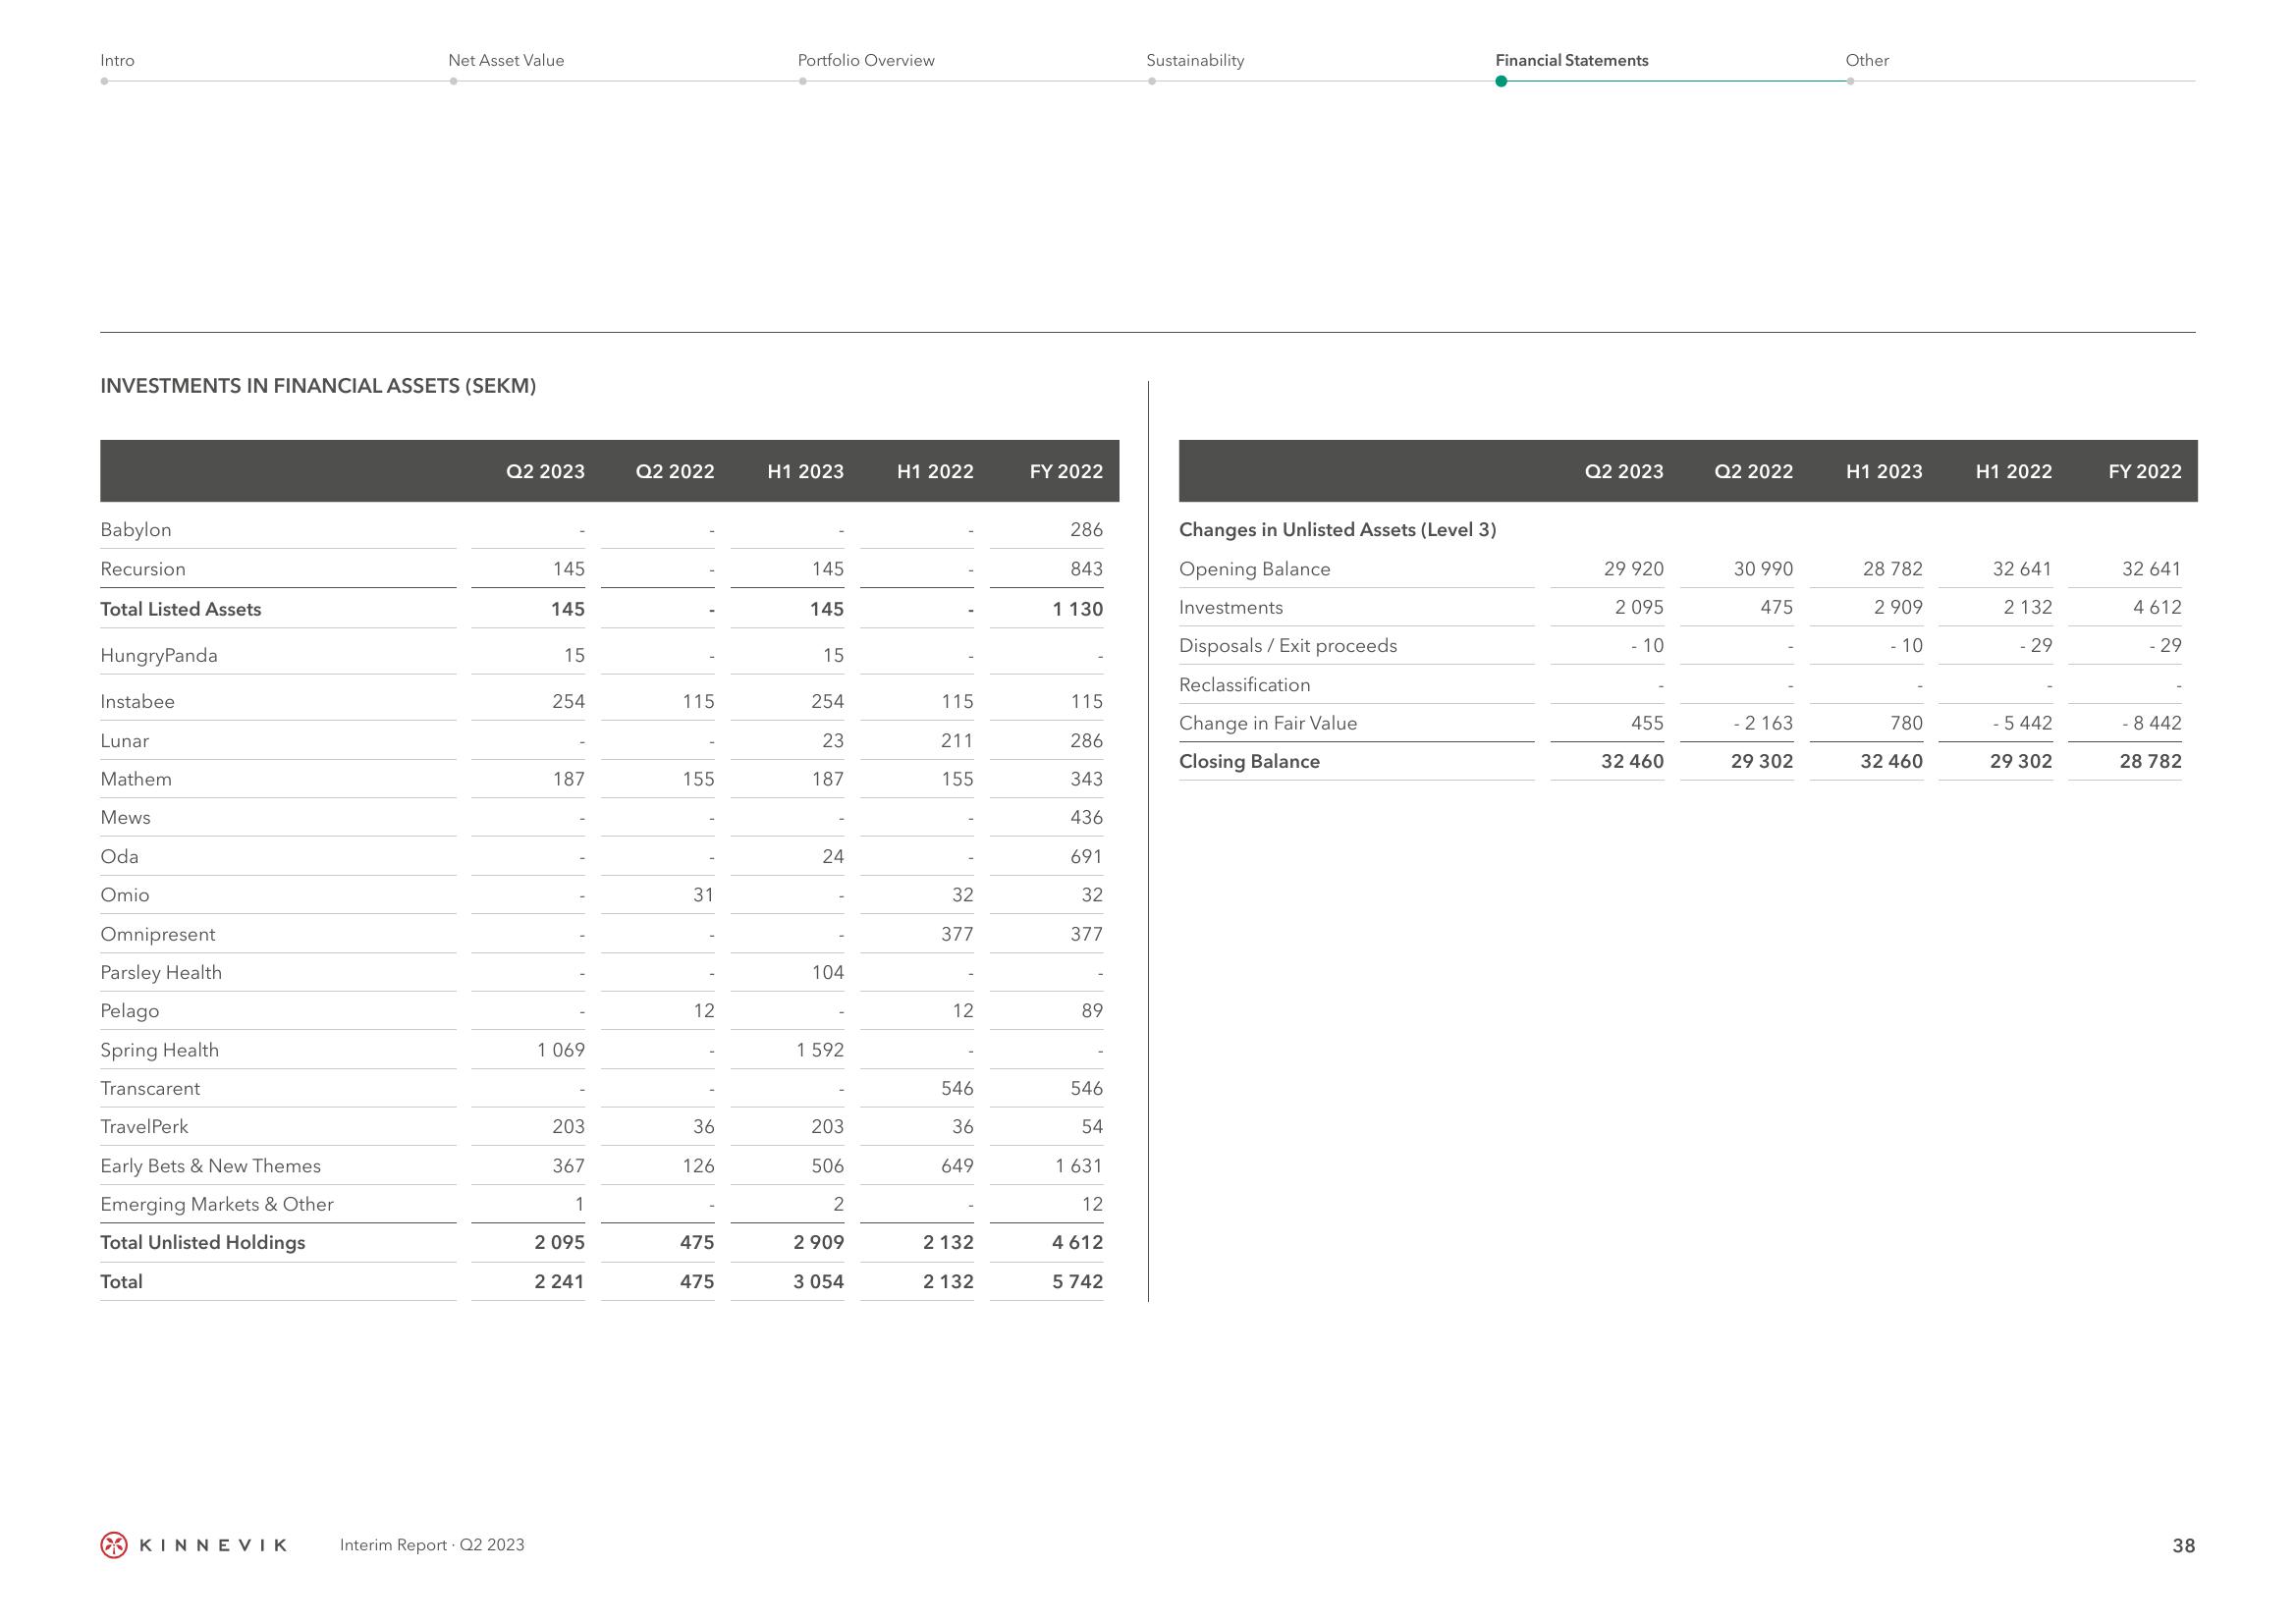
INVESTMENTS IN FINANCIAL ASSETS (SEKM)
Babylon
Recursion
Total Listed Assets
HungryPanda
Instabee
Lunar
Mathem
Mews
Oda
Omio
Omnipresent
Parsley Health
Pelago
Spring Health
Transcarent
TravelPerk
Early Bets & New Themes
Emerging Markets & Other
Total Unlisted Holdings
Total
Net Asset Value
KINNEVIK
Q2 2023
Interim Report Q2 2023
145
145
15
254
187
1 069
203
367
1
2 095
2 241
Q2 2022
1
115
155
31
12
1
36
126
475
475
Portfolio Overview
H1 2023
145
145
15
254
23
187
24
104
1 592
203
506
2
2 909
3 054
H1 2022
115
211
155
32
377
12
546
36
649
2132
2 132
FY 2022
286
843
1 130
115
286
343
436
691
32
377
89
546
54
1 631
12
4612
5 742
Sustainability
Financial Statements
Changes in Unlisted Assets (Level 3)
Opening Balance
Investments
Disposals / Exit proceeds
Reclassification
Change in Fair Value
Closing Balance
Q2 2023
29 920
2 095
- 10
455
32 460
Q2 2022
30 990
475
- 2 163
29 302
Other
H1 2023
28 782
2 909
- 10
780
32 460
H1 2022
32 641
2 132
- 29
- 5442
29 302
FY 2022
32 641
4612
- 29
- 8 442
28 782
38View entire presentation