Zegna Results Presentation Deck
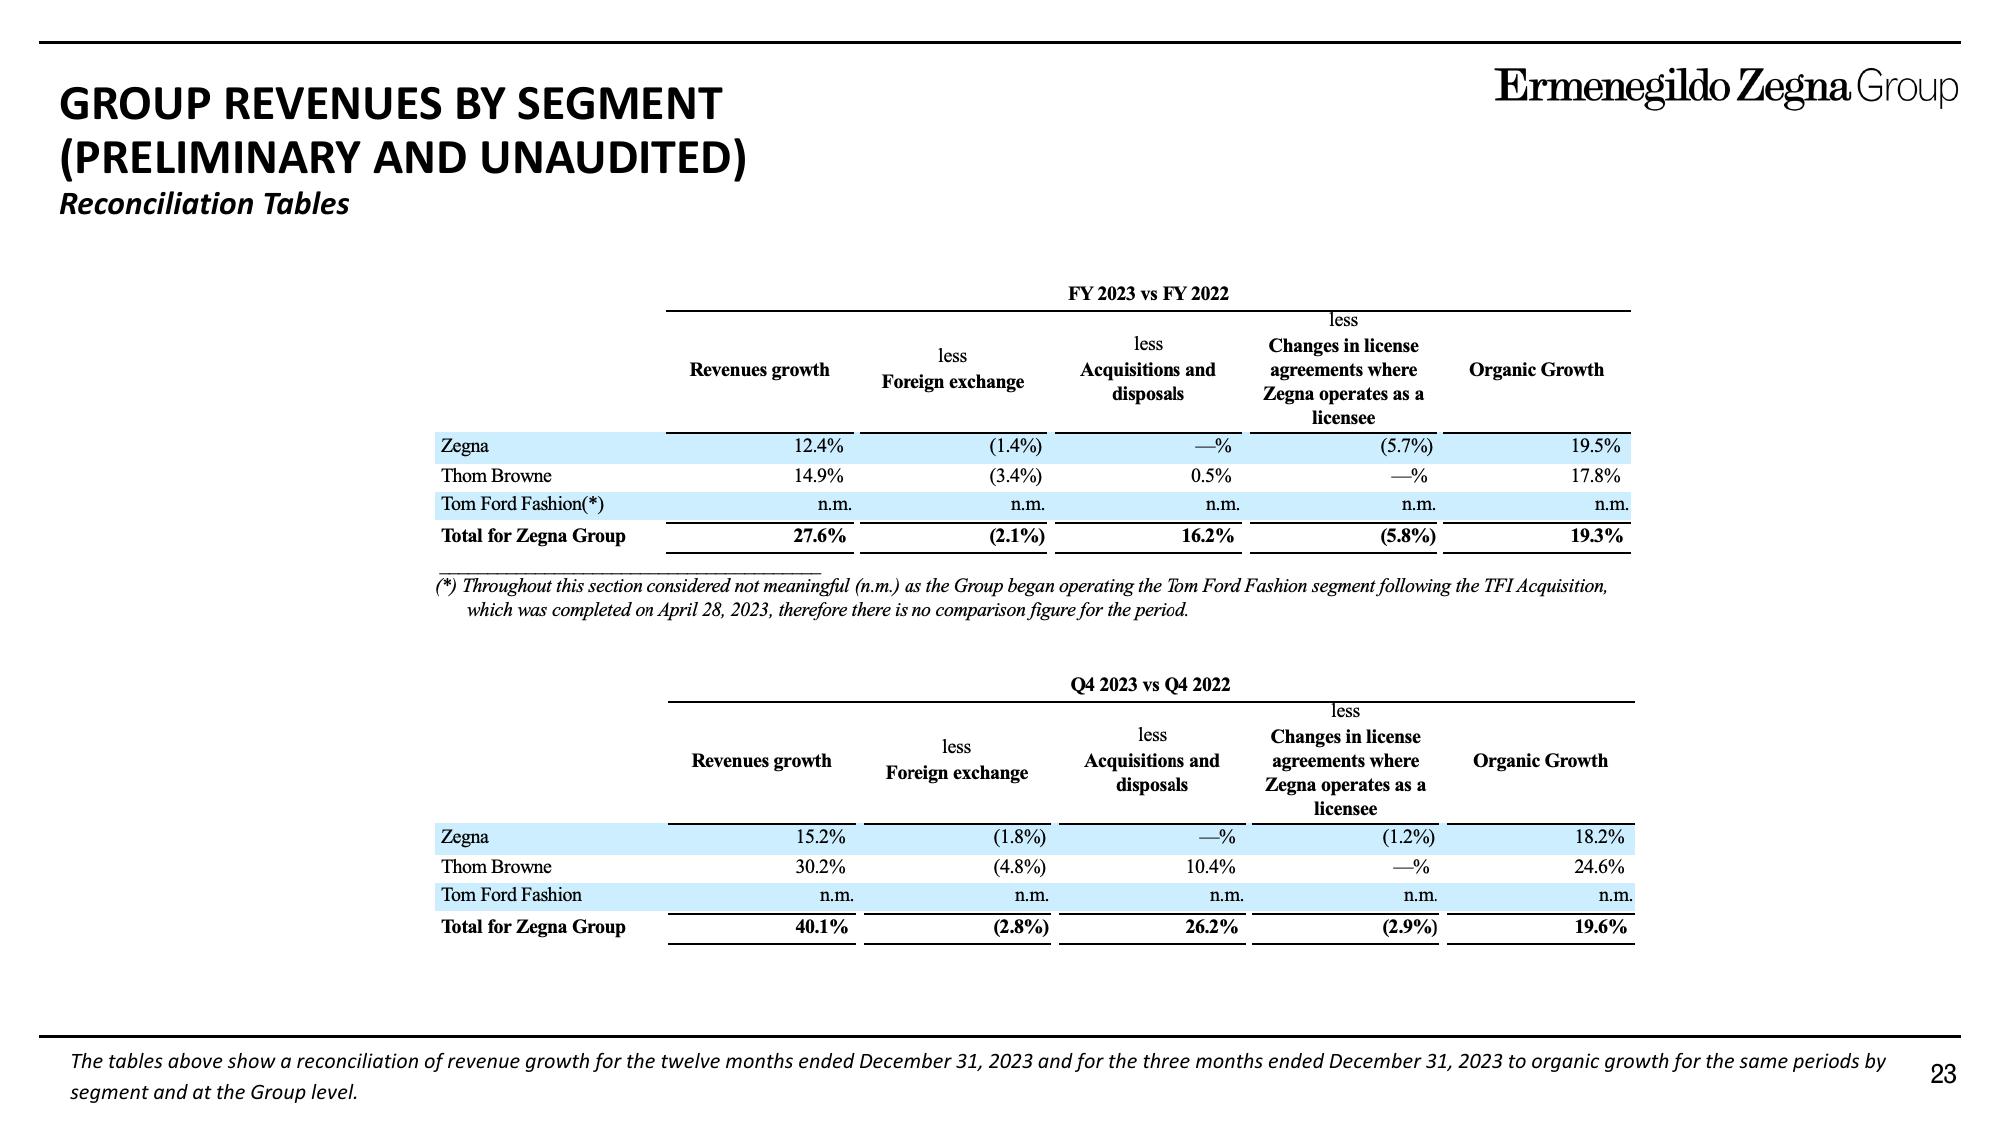
GROUP REVENUES BY SEGMENT
(PRELIMINARY AND UNAUDITED)
Reconciliation Tables
Zegna
Thom Browne
Tom Ford Fashion(*)
Total for Zegna Group
Revenues growth
Zegna
Thom Browne
Tom Ford Fashion
Total for Zegna Group
12.4%
14.9%
n.m.
27.6%
Revenues growth
15.2%
30.2%
n.m.
less
40.1%
Foreign exchange
(1.4%)
(3.4%)
n.m.
(2.1%)
less
Foreign exchange
(1.8%)
(4.8%)
n.m.
FY 2023 vs FY 2022
(2.8%)
less
Acquisitions and
disposals
-%
0.5%
n.m.
16.2%
(*) Throughout this section considered not meaningful (n.m.) as the Group began operating the Tom Ford Fashion segment following the TFI Acquisition,
which was completed on April 28, 2023, therefore there is no comparison figure for the period.
Q4 2023 vs Q4 2022
less
Acquisitions and
disposals
-%
10.4%
n.m.
less
Changes in license
agreements where
Zegna operates as a
licensee
26.2%
(5.7%)
%
n.m.
(5.8%)
less
Changes in license
agreements where
Zegna operates as a
licensee
(1.2%)
-%
n.m.
Ermenegildo Zegna Group
(2.9%)
Organic Growth
19.5%
17.8%
n.m.
19.3%
Organic Growth
18.2%
24.6%
n.m.
19.6%
The tables above show a reconciliation of revenue growth for the twelve months ended December 31, 2023 and for the three months ended December 31, 2023 to organic growth for the same periods by
segment and at the Group level.
23View entire presentation