WeWork Investor Day Presentation Deck
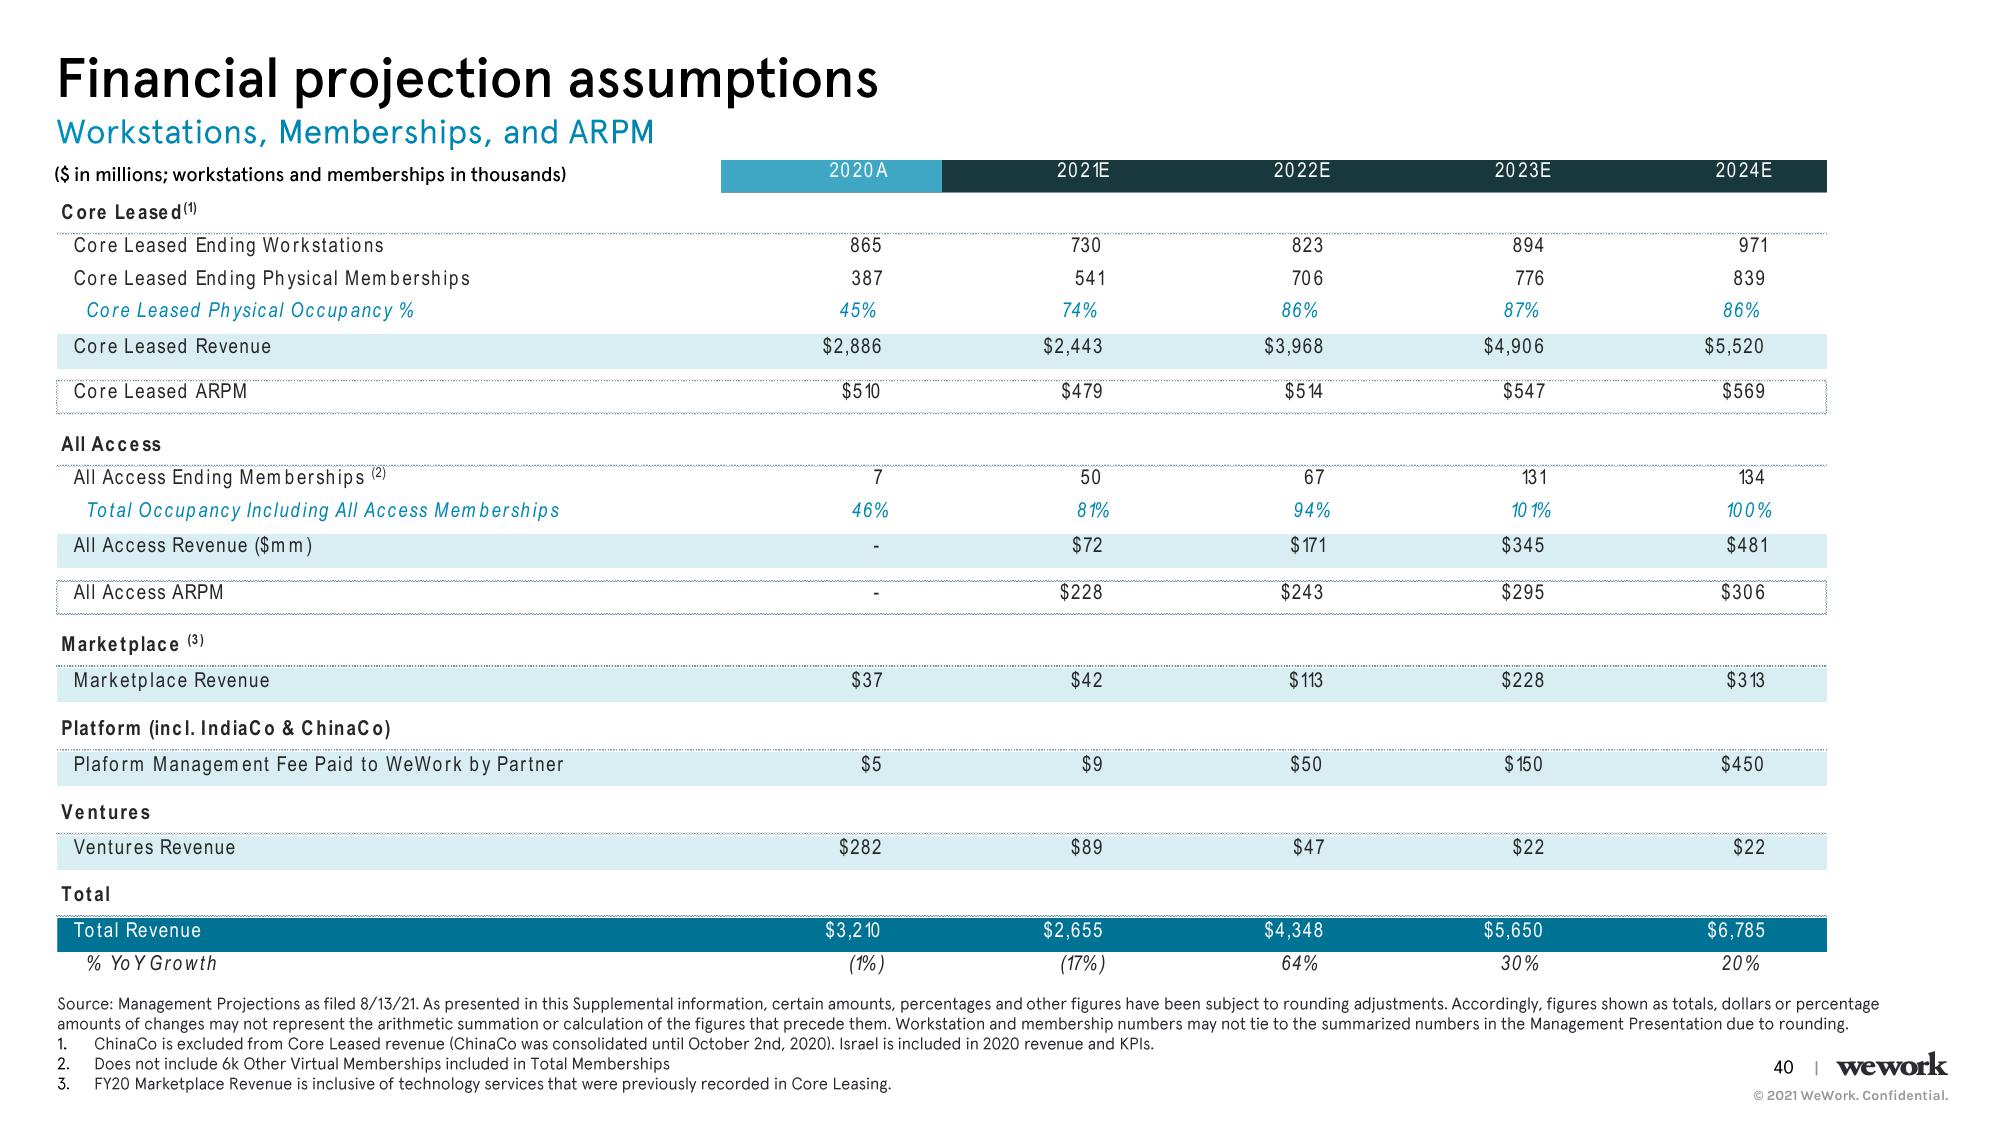
Financial projection assumptions
Workstations, Memberships, and ARPM
($ in millions; workstations and memberships in thousands)
Core Leased (1)
Core Leased Ending Workstations
Core Leased Ending Physical Memberships
Core Leased Physical Occupancy %
Core Leased Revenue
Core Leased ARPM
All Access
All Access Ending Memberships (2)
Total Occupancy Including All Access Memberships
All Access Revenue ($mm)
All Access ARPM
Marketplace (3)
Marketplace Revenue
Platform (incl. IndiaCo & ChinaCo)
Plaform Management Fee Paid to WeWork by Partner
Ventures
Ventures Revenue
Total
2020A
865
387
45%
$2,886
$510
7
46%
$37
$5
$282
2021E
$3,210
(1%)
730
541
74%
$2,443
$479
50
81%
$72
$228
$42
$9
$89
2022E
$2,655
(17%)
823
706
86%
$3,968
$514
67
94%
$171
$243
$113
$50
$47
$4,348
64%
2023E
894
776
87%
$4,906
$547
131
10 1%
$345
$295
$228
$150
$22
$5,650
30%
2024E
971
839
86%
$5,520
$569
134
100%
$481
$306
Total Revenue
% Yo Y Growth
Source: Management Projections as filed 8/13/21. As presented in this Supplemental information, certain amounts, percentages and other figures have been subject to rounding adjustments. Accordingly, figures shown as totals, dollars or percentage
amounts of changes may not represent the arithmetic summation or calculation of the figures that precede them. Workstation and membership numbers may not tie to the summarized numbers in the Management Presentation due to rounding.
1. ChinaCo is excluded from Core Leased revenue (ChinaCo was consolidated until October 2nd, 2020). Israel is included in 2020 revenue and KPIs.
2.
Does not include 6k Other Virtual Memberships included in Total Memberships.
3.
FY20 Marketplace Revenue is inclusive of technology services that were previously recorded in Core Leasing.
$313
$450
$22
$6,785
20%
40 | wework
Ⓒ2021 WeWork. Confidential.View entire presentation